News Next article
Property Price Index - April 2022
Wellington supply surges to nearly double in 12 months
12 May 2022The number of properties for sale in the Wellington region increased by a ‘staggering’ 90 per cent in April when compared with the same month in 2021, according to the latest Trade Me Property Price Index.
Trade Me Property Sales Director Gavin Lloyd said along with the Capital, every other region apart from the West Coast saw an annual jump in supply. “Some of the largest increases were seen in the Manawatū/Whanganui (up 86%) and Hawke’s Bay (up 85%) regions.”
Nationwide, Mr Lloyd said the number of properties for sale jumped by 39 per cent in April, the largest annual percentage increase on record. “This follows the previous all-time high 32 per cent year-on-year increase we saw in March.
“Prior to the pandemic, we would usually see market supply begin to cool off for Winter, when Kiwis tend to stay put and the market is a little quieter. This just isn’t the case anymore, with the number of properties for sale skyrocketing around the country last month.”
My Lloyd said with such a surge in supply, buyers have plenty of options and are therefore feeling less pressure. ”As a result, in some regions we’re starting to see the property market enter a stalemate situation where buyers simply aren’t willing to pay the price sellers are asking and they’re at a standstill.”
| Region | Supply % change | ||
|---|---|---|---|
| Wellington | Wellington | +90% | +90% |
| Manawatū/Whanganui | Manawatū/Whanganui | +86% | +86% |
| Hawke's Bay | Hawke's Bay | +85% | +85% |
| Bay of Plenty | Bay of Plenty | +68% | +68% |
| Nelson/Tasman | Nelson/Tasman | +67% | +67% |
| Waikato | Waikato | +57% | +57% |
| Auckland | Auckland | +30% | +30% |
| Southland | Southland | +26% | +26% |
| Canterbury | Canterbury | +23% | +23% |
| Taranaki | Taranaki | +22% | +22% |
| Otago | Otago | +22% | +22% |
| Gisborne | Gisborne | +21% | +21% |
| Northland | Northland | +20% | +20% |
| Marlborough | Marlborough | +4% | +4% |
| West Coast | West Coast | -10% | -10% |
| Nationwide | Nationwide | +39% | +39% |
Despite supply changes flouting the normal pattern, Mr Lloyd said demand dwindled as expected last month. “In April, nationwide demand dropped by 4 per cent year-on-year, and 14 per cent on the month prior.
“This is telling us that buyers aren’t in the same situation they were 6-12 months ago. The FOMO has gone and some are willing to wait it out and see how things pan out over the next little while.”
Record high asking price is seen in a number of regions
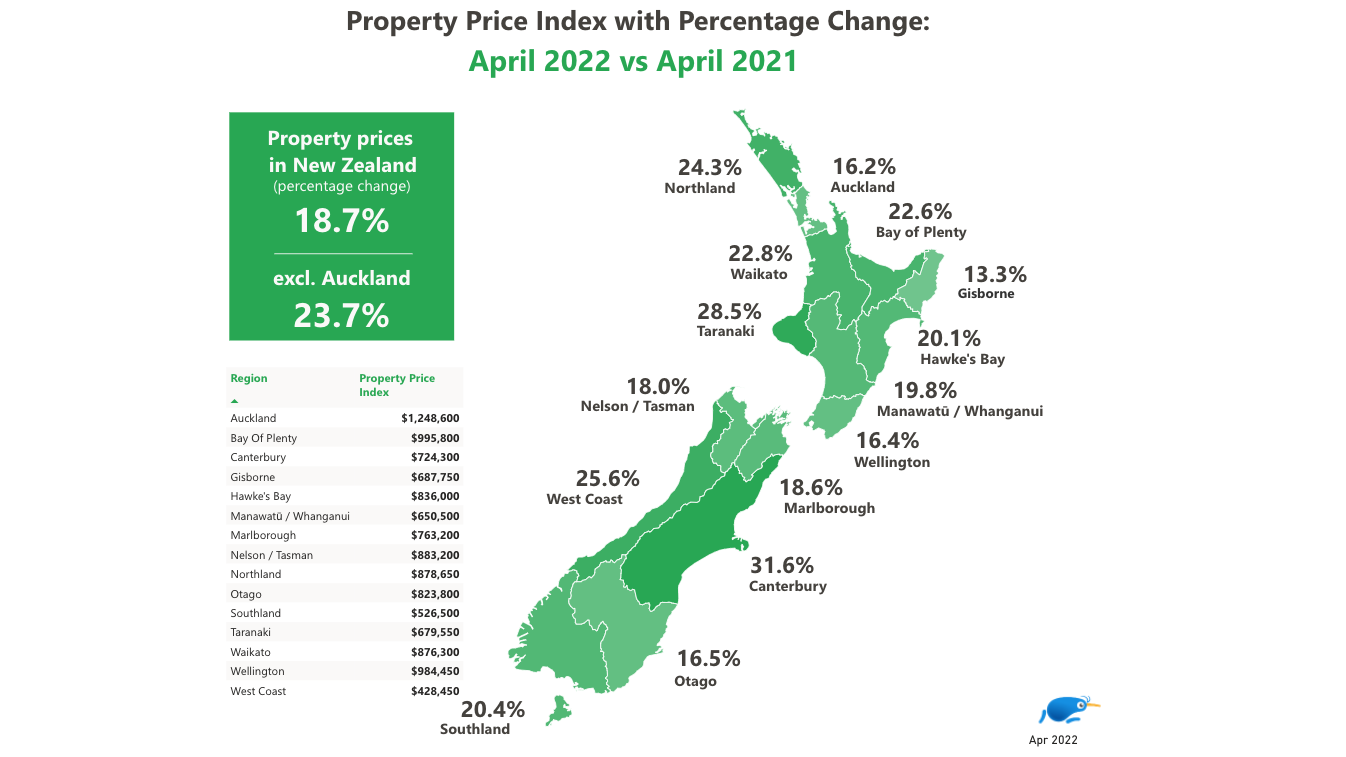
Mr Lloyd said all-time high asking prices were seen in the Canterbury, Gisborne, and Manawatū/Whanganui, regions last month.
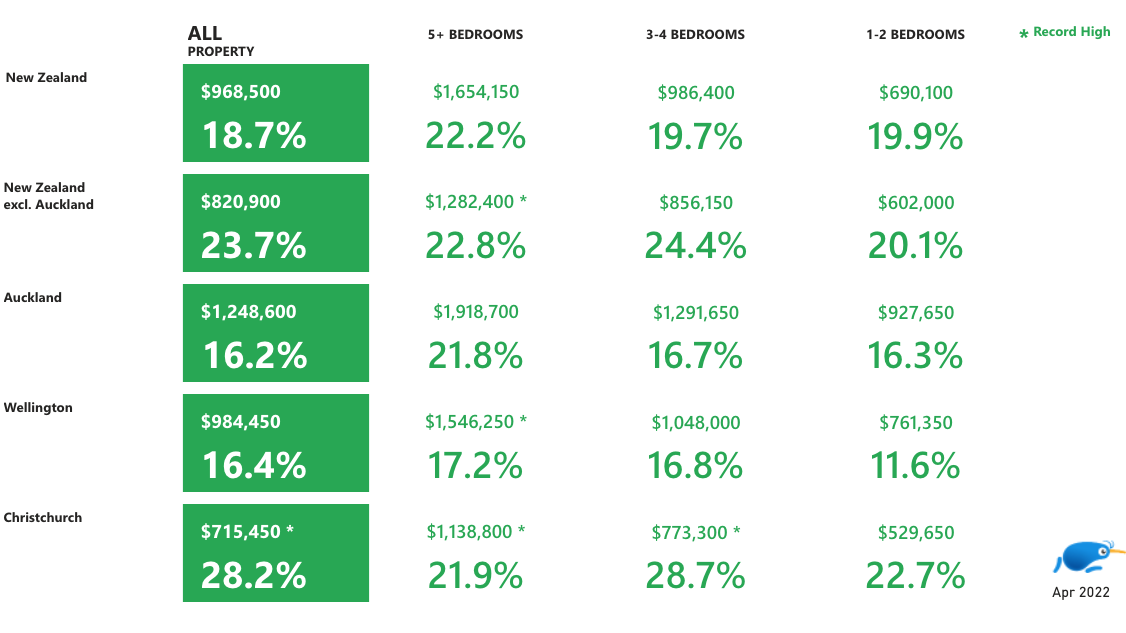
“The national average asking price was $968,500 in April, marking an increase of $152,650 (+19%) when compared with April 2021.”
The largest percentage year-on-year increase was seen in the Canterbury region (up 32%) followed by Taranaki (up 29%) and West Coast (up 26%).
Wellington prices edge closer to $1m
The Wellington region saw an average asking price of $984,450, last month, marking an increase of 16 per cent year-on-year and a drop of 1 per cent when compared with the month prior.
Looking at Wellington City, Mr Lloyd said the district’s average asking price increased by 14 per cent to reach $1,084,900 last month. “This made it the most expensive district in the region, followed by South Wairarapa ($1,059,300) and Porirua ($1,051,250).”
| District | Average asking price - April 2022 | ||
|---|---|---|---|
| Wellington City | Wellington City | $1,084,900 | $1,084,900 |
| South Wairarapa | South Wairarapa | $1,059,300 | $1,059,300 |
| Porirua | Porirua | $1,051,250 | $1,051,250 |
While supply surged in Wellington last month, demand in the region grew by a comparatively small 4 per cent year-on-year.
The Capital’s most popular property in April was a four-bedroom, three-bathroom house on Tennis Court Road, Kapiti Coast. “It had an asking price of $1,400,000 and was watchlisted 403 times in its first seven days onsite.”
Auckland prices increase by 16 per cent year-on-year
The average asking price in the Auckland region was $1,248,600 in April, climbing 16 per cent year-on-year and dropping by 1 per cent month-on-month.
“Looking at Auckland City, the average asking price was $1,374,250 in April, making it the fourth most expensive district in the region.” The most expensive districts in Auckland last month were Waiheke Island ($1,678,400), North Shore City ($1,476,650), and Rodney ($1,380,250).
| District | Average asking price - April 2022 | ||
|---|---|---|---|
| Waiheke Island | Waiheke Island | $1,678,400 | $1,678,400 |
| North Shore City | North Shore City | $1,476,650 | $1,476,650 |
| Rodney | Rodney | $1,380,250 | $1,380,250 |
Supply in the Auckland region was up 30 per cent year-on-year in April, while demand dropped 11 per cent.
Last month’s most popular Auckland property was a five-bedroom, four-bathroom house on Grace Hill Drive, Rodney. "It was watchlisted 324 times in its first 7 days onsite.”
Record average asking prices for all house sizes
Mr Lloyd said nationwide, large houses (5+ bedrooms) saw the largest price increase in April, with the average asking price up 22 per cent year-on-year, to $1,654,150. “The average asking price for both small properties (1-2 bedrooms) and medium properties (3-4 bedrooms) increased by 20 per cent to $690,100 and $986,400 respectively.”
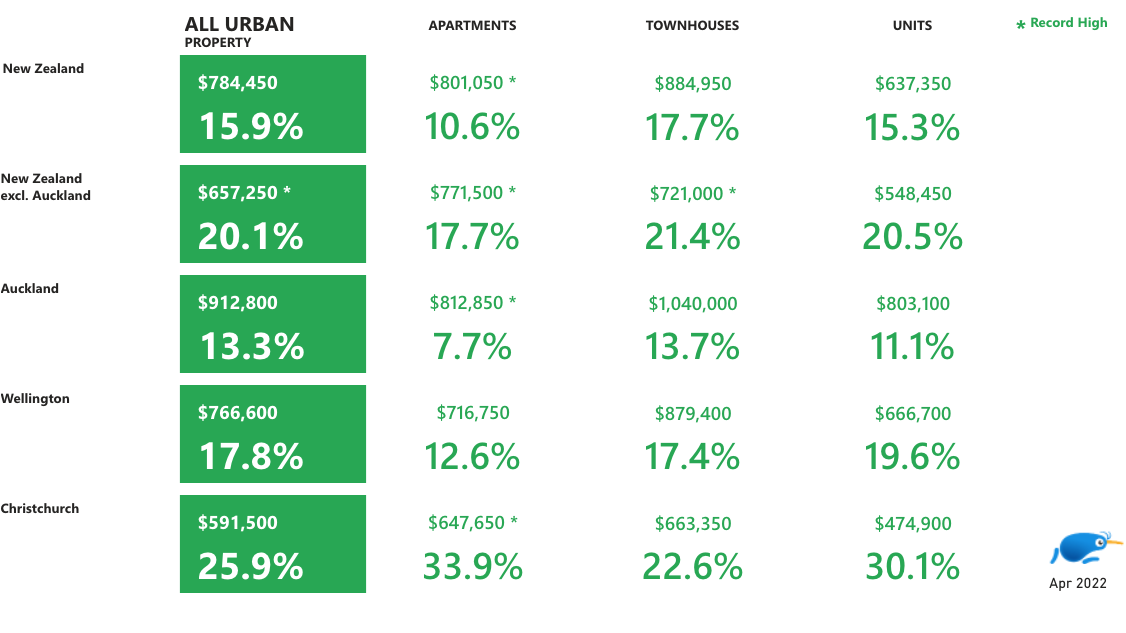
Mr Lloyd said the national average asking price for apartments reached a record high last month, at $801,050. “The largest year-on-year percentage increase in average asking price was for townhouses, which increased by 18 per cent in April to $884,950.”


