News Next article
Property Price Index - December 2020
Property prices experienced their hottest month on record in December, with record highs in every region.
21 January 202121 Gladwin Road, Epsom, Auckland City, Auckland
Property prices experienced their hottest month on record in December, with record highs in every region, according to the latest Trade Me Property Price Index.
Trade Me Property spokesperson Logan Mudge said the property market ended the year with a bang, with record average asking prices across the board. ”This is the first time we have seen the average asking price in every single region reach a new record in the six years we have reported on the market. It’s fair to say the New Zealand property market has never been hotter.”
Mr Mudge said the national average asking price also had a record-breaking month, increasing by an “eye-watering” 13 per cent in December when compared with the same period in 2019 to $767,050.
“We saw property prices go from strength to strength throughout 2020 and in December they finished the year with a bang.
“Despite the lockdown, 2020 saw the national average asking price climb incrementally throughout the year, challenging some predictions that the market would take a huge hit as a result of the pandemic. This reached a climax at the end of 2020, with double-digit percentage increases every month since September.”
| Month | National average asking price - 2019 | National average asking price - 2020 | Year-on-year increase | ||||
|---|---|---|---|---|---|---|---|
| January | January | $647,650 | $647,650 | $666,900 | $666,900 | +3% | +3% |
| February | February | $663,350 | $663,350 | $677,900 | $677,900 | +2.2% | +2.2% |
| March | March | $676,000 | $676,000 | $695,800 | $695,800 | +2.9% | +2.9% |
| April | April | $673,950 | $673,950 | $706,250 | $706,250 | +4.8% | +4.8% |
| May | May | $663,800 | $663,800 | $701,150 | $701,150 | +5.6% | +5.6% |
| June | June | $648,650 | $648,650 | $699,350 | $699,350 | +7.8% | +7.8% |
| July | July | $638,500 | $638,500 | $697,100 | $697,100 | +9.2% | +9.2% |
| August | August | $643,350 | $643,350 | $701,700 | $701,700 | +9.1% | +9.1% |
| September | September | $650,050 | $650,050 | $717,600 | $717,600 | +10.4% | +10.4% |
| October | October | $672,600 | $672,600 | $742,950 | $742,950 | +10.5% | +10.5% |
| November | November | $678,250 | $678,250 | $762,700 | $762,700 | +12.5% | +12.5% |
| December | December | $676,300 | $676,300 | $767,050 | $767,050 | +13.4% | +13.4% |
Mr Mudge said nationwide, demand was up 15 per cent on December 2019 while supply was down 9 per cent. “It’s the same story we’ve seen for the last 12 months, demand is up and supply is down and as long as this picture remains prices will continue to skyrocket.”
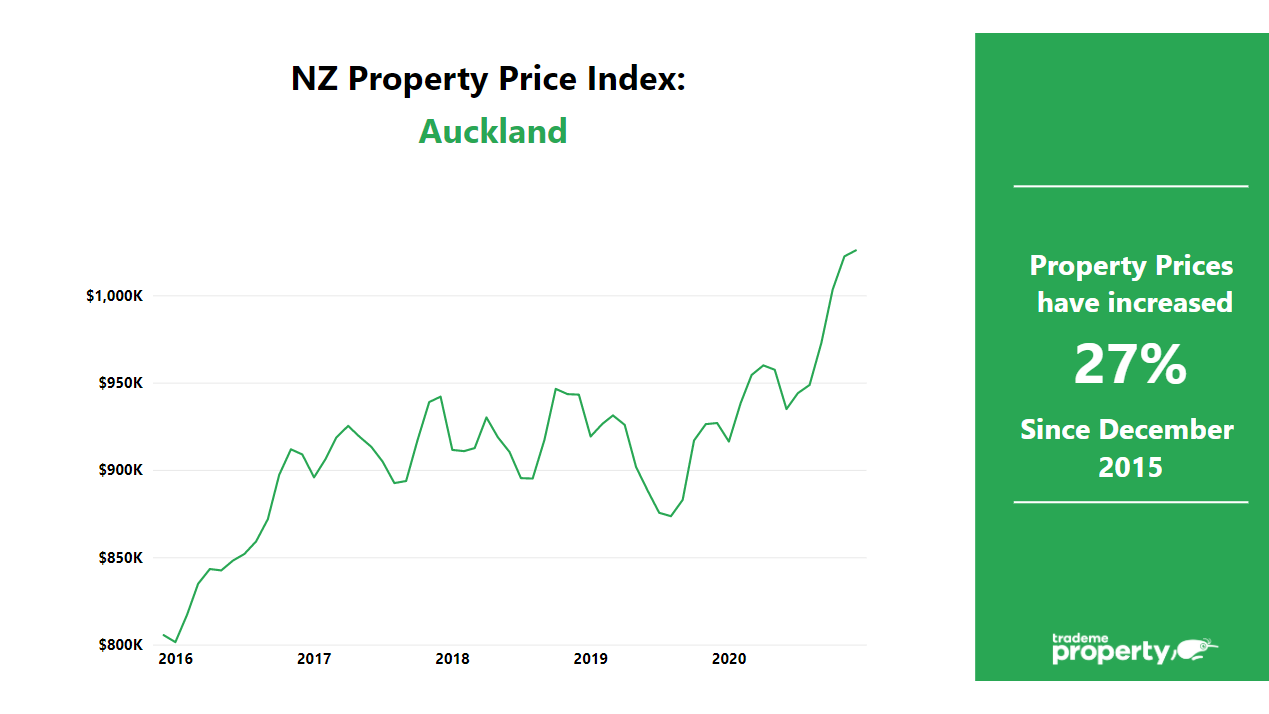
Auckland prices up 11 per cent year-on-year
The average asking price in the Auckland region kept climbing beyond $1m for the third consecutive month in December. “The average asking price in the region reached $1,025,700 in December up 11 per cent when compared with the same month in 2019.
“While supply in Auckland climbed 8 per cent, it couldn’t keep up with demand, which was up by a staggering 25 per cent year-on-year.”
In Auckland City, Mr Mudge said the average asking price saw even stronger growth, up 13 per cent year-on-year to $1,217,250. “This made Auckland City the second most expensive district in the region.”
Mr Mudge said the most expensive district in the region was North Shore City at $1,233,250, with Waiheke ($1,204,800) in third place.
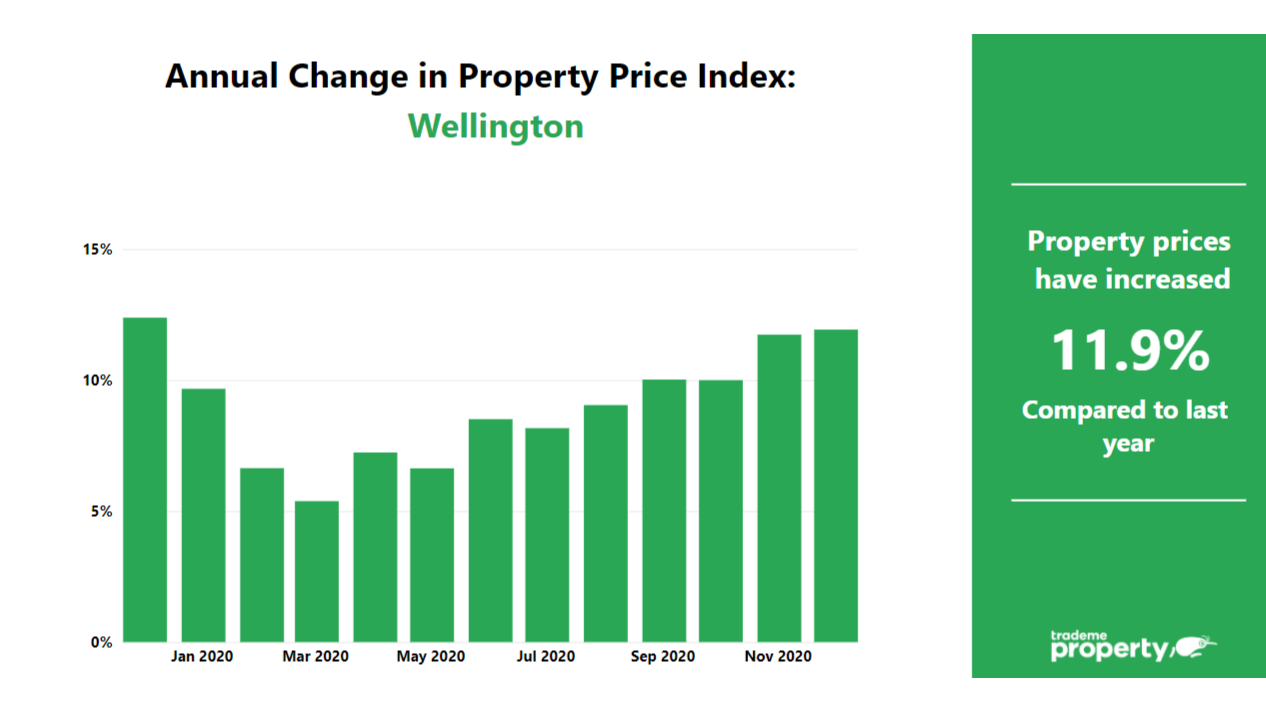
Record-breaking month in Wellington
The average asking price in the Wellington region was $763,400 in December, up 12 per cent when compared with the same month in 2019. “Mirroring the national trend, demand in the region was up by 19 per cent while supply was down by 10 per cent. This continues to put pressure on the Wellington property market and as a result prices are heading north.”
“Taking a closer look at the region, many districts saw new records and strong double-digit price growth. The average asking price in Wellington City hit a new high after climbing 11 per cent year-on-year to $866,550.”
Mr Mudge said Upper Hutt (up 13 per cent to $691,050), Masterton (up 19 per cent to $540,900), Kapiti Coast (up 10 per cent to $721,300) and South Wairarapa (up 6 per cent to $689,300) also hit new records.
The average asking price in Porirua rose 4 per cent to $794,200 while Lower Hutt climbed 15 per cent to $722,400.
Regions all see prices grow
“December saw some incredible price growth across the country with nine of New Zealand’s fifteen regions seeing strong double digit increases.”
The biggest price growth was seen in Gisborne (up 32%), Manawatū/Whanganui (up 22%), Southland (up 15%), and Otago (up 13%).
“Bay of Plenty, West Coast, Taranaki, and Wellington all saw a 12 per cent increase in their average asking price when compared with December 2019.”
“Marlborough and Nelson/Tasman had an interesting month as the only regions that saw a large drop in both supply and demand when compared with the same month in 2019.
“Supply in Marlborough was down by 42 per cent year-on-year, while demand in the region was down by 20 per cent, resulting in price increases. “It was a similar story in Nelson, with demand down by 4 per cent, while supply dropped by 34 per cent year-on-year.”
Records for all house types
The national average asking price for small (1-2 bedrooms), medium (3-4 bedrooms), and large (5+ bedrooms) all saw a year-on-year increase in average asking prices in December. “The largest increase was seen for small and large houses, which both saw a 15 per cent year-on-year increase.”
Mr Mudge said the national average asking price for units reached an all-time high in December. “The average asking price for a unit cracked the 500k mark for the first time, reaching $505,100 last month”
MORE INFORMATION
About the Trade Me Property Price Index:
- The Trade Me Property Price Index measures trends in the expectations of selling prices for residential property listings added to Trade Me Property by real estate agents and private sellers over the past three months.
- It provides buyers, sellers and realtors with insights into ‘for sale’ price trends by property type and property size.
- The Index is produced from data on properties listed on Trade Me Property in the three months leading up to the last day of each period. Each period’s value is a truncated mean of the complete three months’ worth of listings. This is to better reflect trends in property prices rather than month-to-month fluctuations in housing stock.
- The Index uses an “80% truncated mean” of the expected sale price to calculate the average asking price. This excludes the upper and lower 10% of listings by price, and averages the expected sale prices of the remaining properties.
- It provides an insight into ‘for sale’ price trends by type and size of property. Other reports aggregate property price data across these various properties.


