News Next article
Property Price Index - June 2021
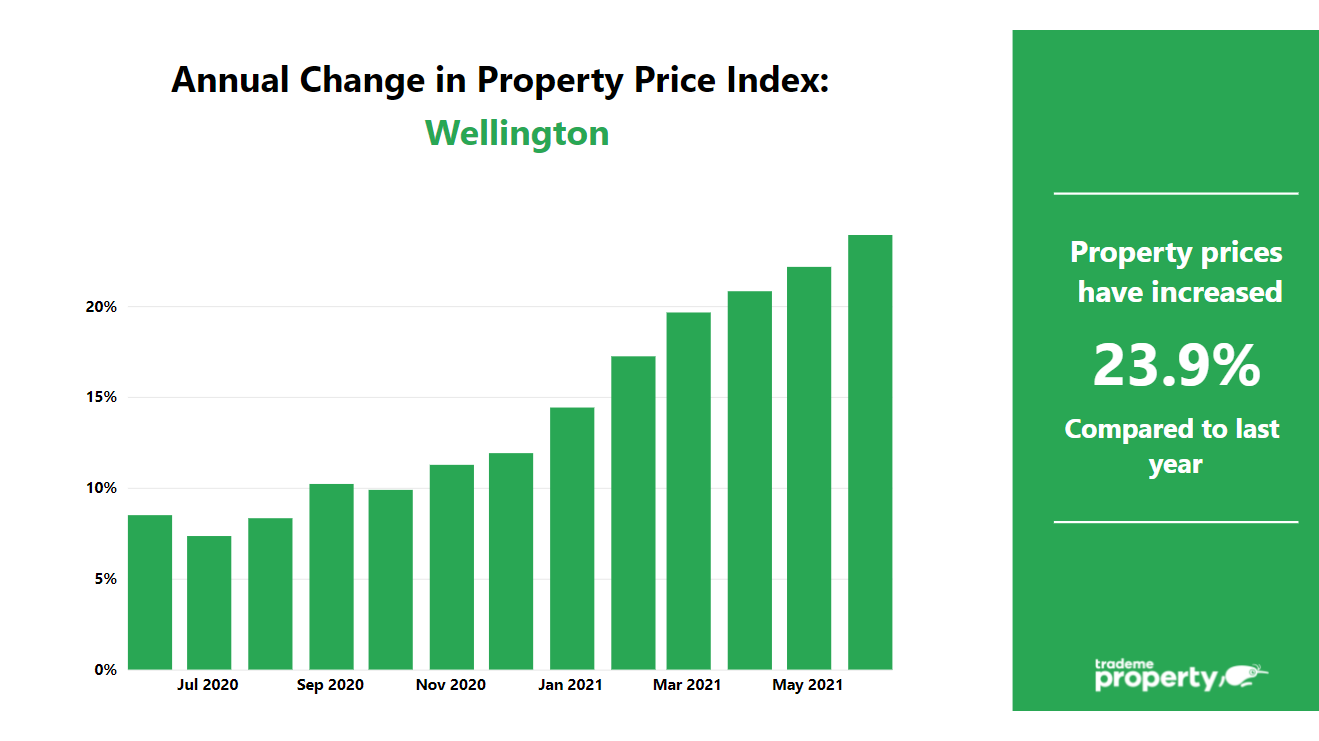
Wellington house prices sky-rocketed in June, seeing the largest annual increase on record.
23 July 2021Wellington house prices sky-rocketed in June, seeing the largest annual increase on record, according to the latest Trade Me Property Price Index.
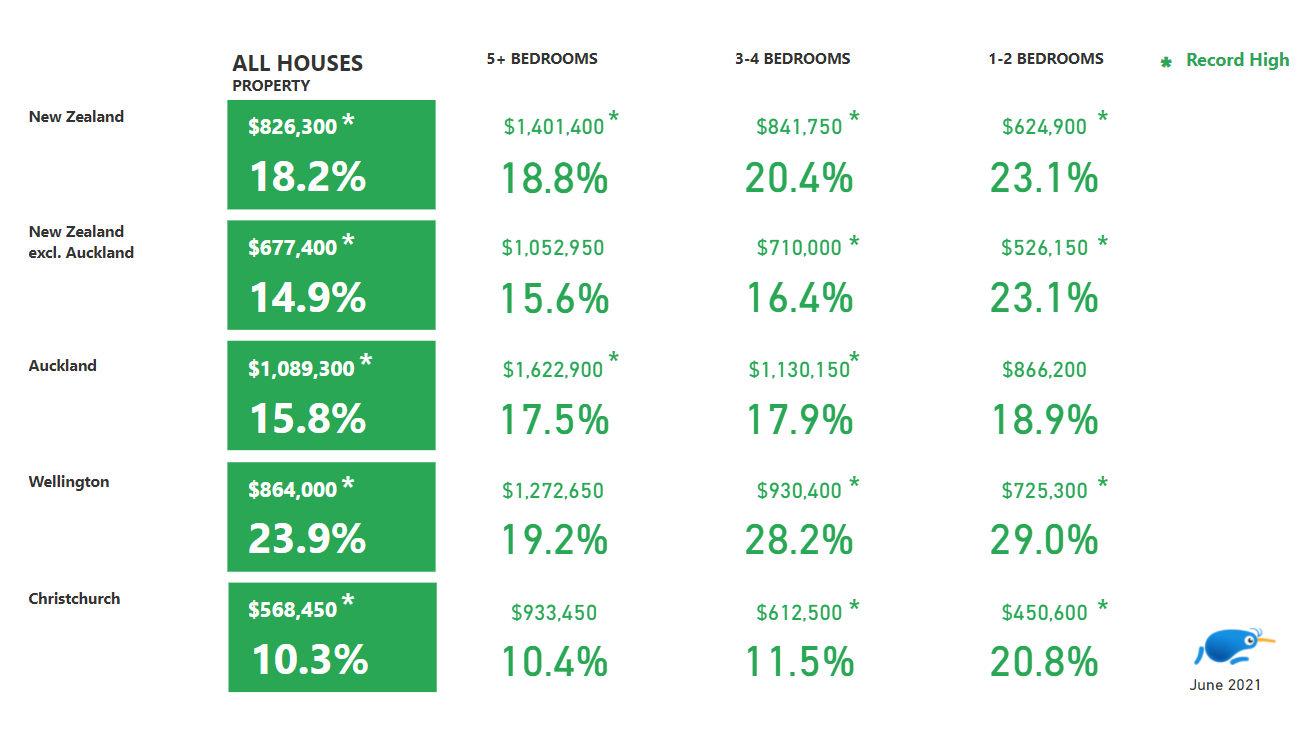
Trade Me Property Sales Director Gavin Lloyd said the average asking price in the Wellington region saw some ‘eye-watering’ growth last month, climbing 24 per cent on June last year to a record-breaking $864,000. That’s an increase of $166,300 in just 12 months.
“June marks the fourth consecutive month where we’ve seen property price growth of 20 per cent or more in Wellington. The fact is, the Wellington property market is now running hotter than any other market we’ve seen before, including Auckland.”
Mr Lloyd said a lack of properties for sale was driving price increases in the region. “Supply has long been an issue for the Wellington market and in June the number of houses for sale was down 13 per cent on the same time last year.”
Taking a closer look at the region, Wellington City saw the smallest annual growth of all the Wellington districts, climbing 15 per cent to a record-breaking $943,900.
“With the average house price in Wellington City closing in on a million dollars, it’s no wonder we’ve seen Kiwis in the capital look further afield in search of cheaper house prices in exchange for a longer commute.”
Mr Lloyd said South Wairarapa saw the biggest price jump in the region with the average asking price up 39 per cent on last June to a new high of $784,550. Masterton (up 32 per cent to $629,700), Carterton (up 30 per cent to a record-breaking $699,450), Kapiti Coast (up 29 per cent to a new high of $876,650), Porirua (up 21 per cent to $885,250), Lower Hutt (up 26 per cent to a record-breaking $836,700), and Upper Hutt (up 27 per cent to $821,950), all saw significant jumps in average asking price.
However, Mr Lloyd said this rate of growth was unsustainable. “While there are yet to be any signs that the Wellington property market is slowing down, this huge price growth simply cannot continue forever.”
Auckland prices pick up pace
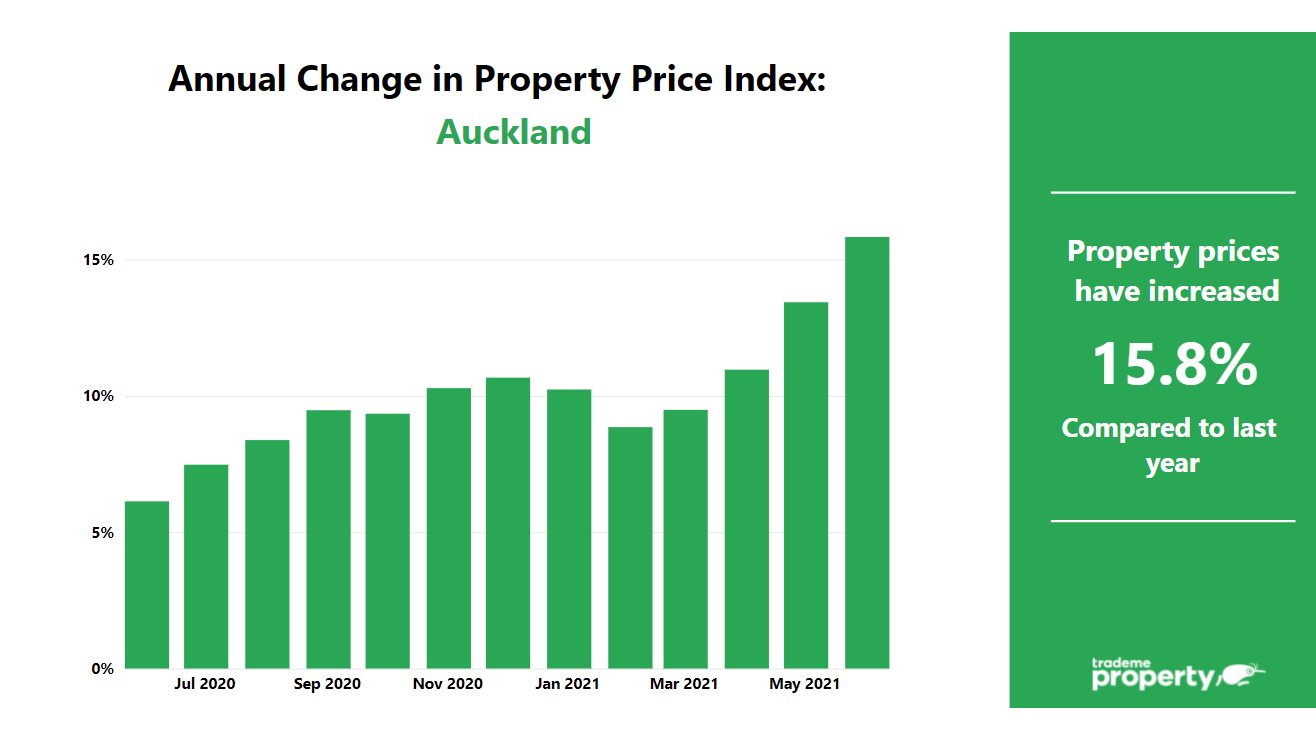
“Following Wellington’s trend, the average asking price in Auckland saw the biggest price growth ever in June, jumping 16 per cent year-on-year to an all-time high of $1,089,300.
“Just when it appeared as though price growth was easing in the Auckland market, prices have taken off yet again with a record-breaking annual increase of almost $150,000.”
Mr Lloyd said Auckland City saw a 13 per cent jump in average asking price to $1,216,900, Manukau City reached a new record following a 15 per cent increase to $1,025,150, and North Shore City rose 14 per cent to $1,271,350.
“Demand for Auckland properties fell 21 per cent on the year prior while supply was down 10 per cent.
“After a year of solid price growth, we know that some prospective buyers are struggling with the fear of missing out (FOMO) and that’s causing them to dig deep into their wallets, and prices to spike.”
New Zealand house prices reach another record
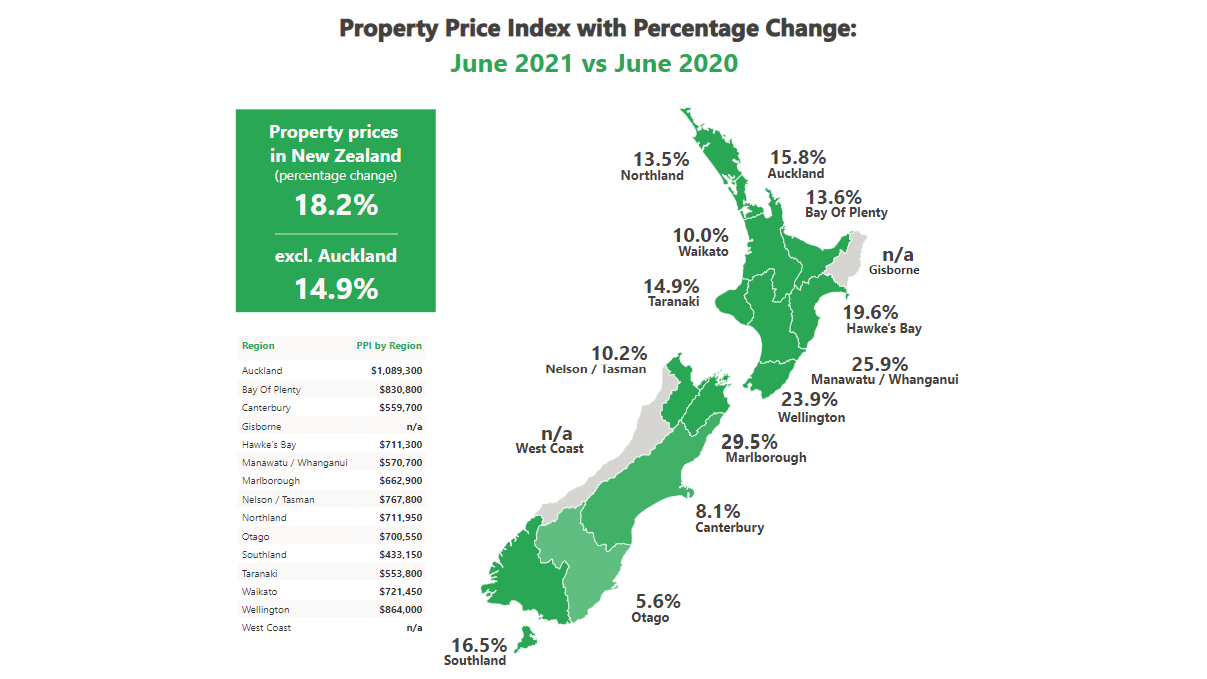
“The national average asking price also saw the largest annual increase we’ve ever seen in June, climbing 18 per cent to an all-time high of $826,200.”
Mr Lloyd said every region in the country apart from Gisborne, Northland and Otago reached a record average asking price in June with many experiencing strong double-digit growth.
“Marlborough (up 30 per cent to $622,900), Manawatu/Whanganui (up 26 per cent to $570,700 and Wellington (up 24 per cent to $864,000) were the standouts in June.”
Small houses the pick of the bunch
Mr Lloyd said nationwide, small houses (1-2 bedrooms) saw the most price growth of any house size in June, following a 23 per cent annual increase to a record-breaking $624,900.
“Medium (3-4 bedrooms) and large houses (5+ bedrooms) also reached a new high after some solid double-digit growth.”
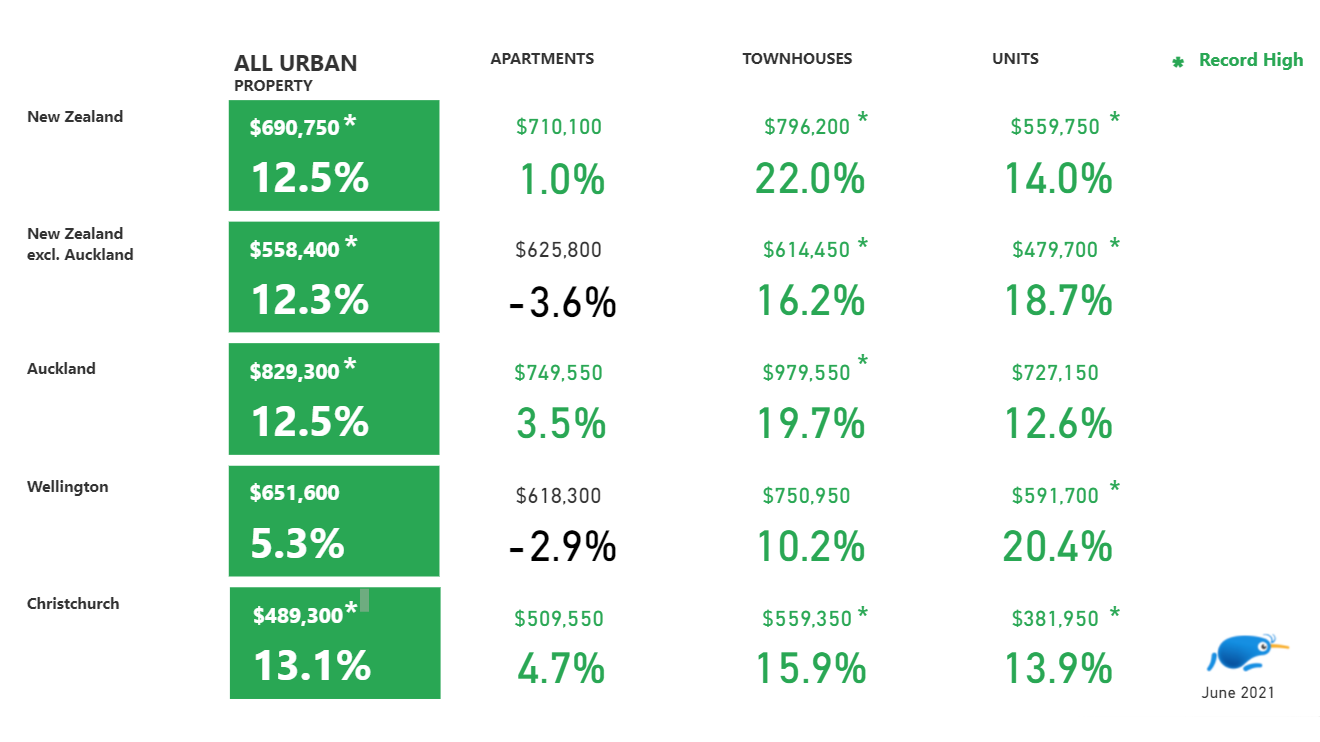
Mr Lloyd said when it came to urban properties like apartments, townhouses and units, townhouses were the hot favourite. “The average asking price for a townhouse in New Zealand rose 22 per cent on June last year to an all-time high at $796,200.”
MORE INFORMATION
About the Trade Me Property Price Index:
- The Trade Me Property Price Index measures trends in the expectations of selling prices for residential property listings added to Trade Me Property by real estate agents and private sellers over the past three months.
- It provides buyers, sellers and realtors with insights into ‘for sale’ price trends by property type and property size.
- The Index is produced from data on properties listed on Trade Me Property in the three months leading up to the last day of each period. Each period’s value is a truncated mean of the complete three months’ worth of listings. This is to better reflect trends in property prices rather than month-to-month fluctuations in housing stock.
- The Index uses an “80% truncated mean” of the expected sale price to calculate the average asking price. This excludes the upper and lower 10% of listings by price, and averages the expected sale prices of the remaining properties.
- It provides an insight into ‘for sale’ price trends by type and size of property. Other reports aggregate property price data across these various properties.