News Next article

Property Price Index - May 2021

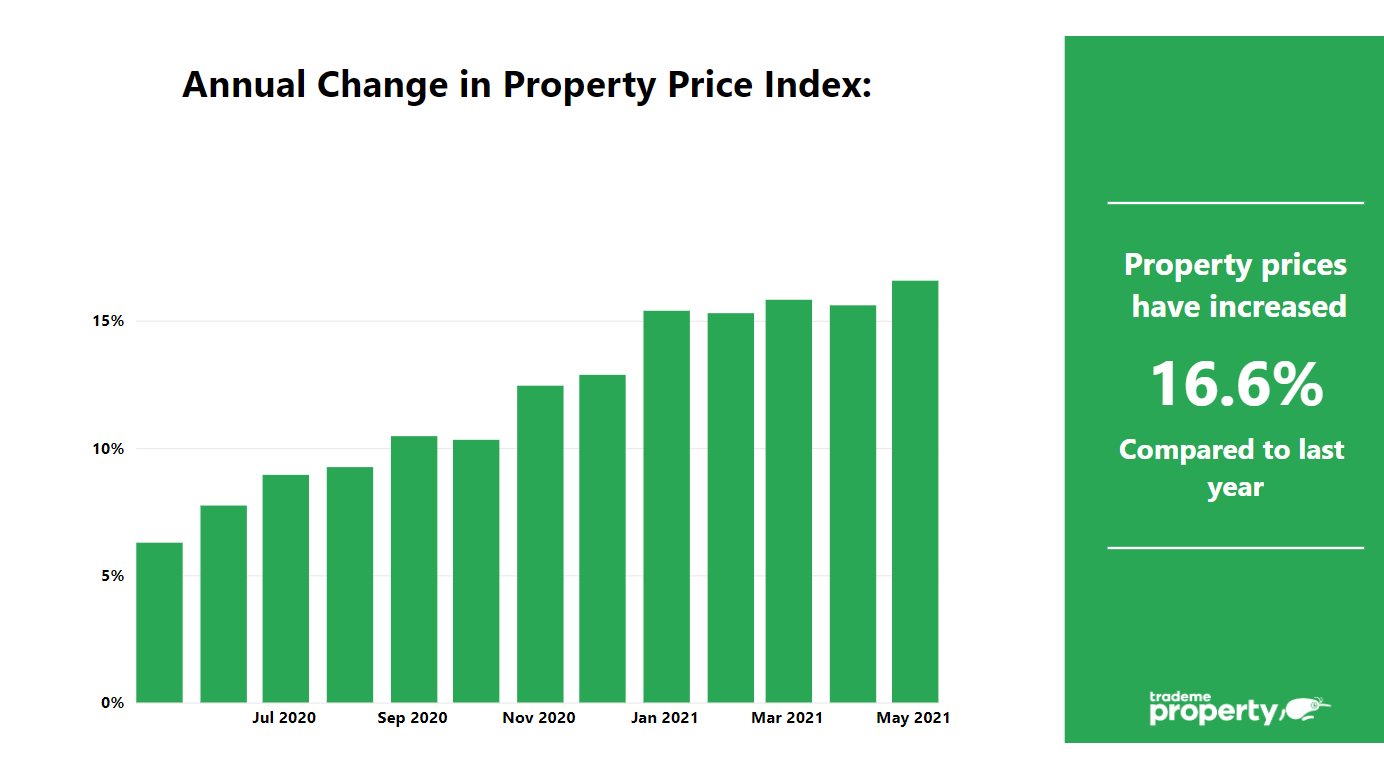
The national average asking price saw its biggest YoY increase of all time in May, increasing by 17% to $820,950.

8 June 2021

37 Chepstow Avenue, Fendalton, Christchurch

The national average asking price saw its biggest year-on-year increase of all time in May, increasing by 17 per cent to $820,950, according to the latest Trade Me Property Price Index.

Trade Me Property Sales Director Gavin Lloyd said May usually sees the property market begin to cool off for the looming winter months, but that didn’t seem to be the case this year. “The national average asking price record breaking streak continued, reaching an all time high for the ninth month in a row in May.”

Mr Lloyd said average asking prices saw a year-on-year increase in every region last month, with Northland the only region to not see a record high. “The biggest year-on-year price increases were seen in Manawatū/Whanganui (25%) and Wellington (22%).”

Increased demand, paired with slowed supply, were behind the blanket price increases. “Views on listings up by 2 per cent nationally in May when compared with the month prior. On the other hand, national supply was down by 3 per cent month-on-month.”

“Our May data tells us that we are still very much in a sellers market. After months of record breaking prices it might feel like there is no relief in sight for buyers, but looking ahead we may yet see activity slow as Kiwis tend to stay put in winter.”

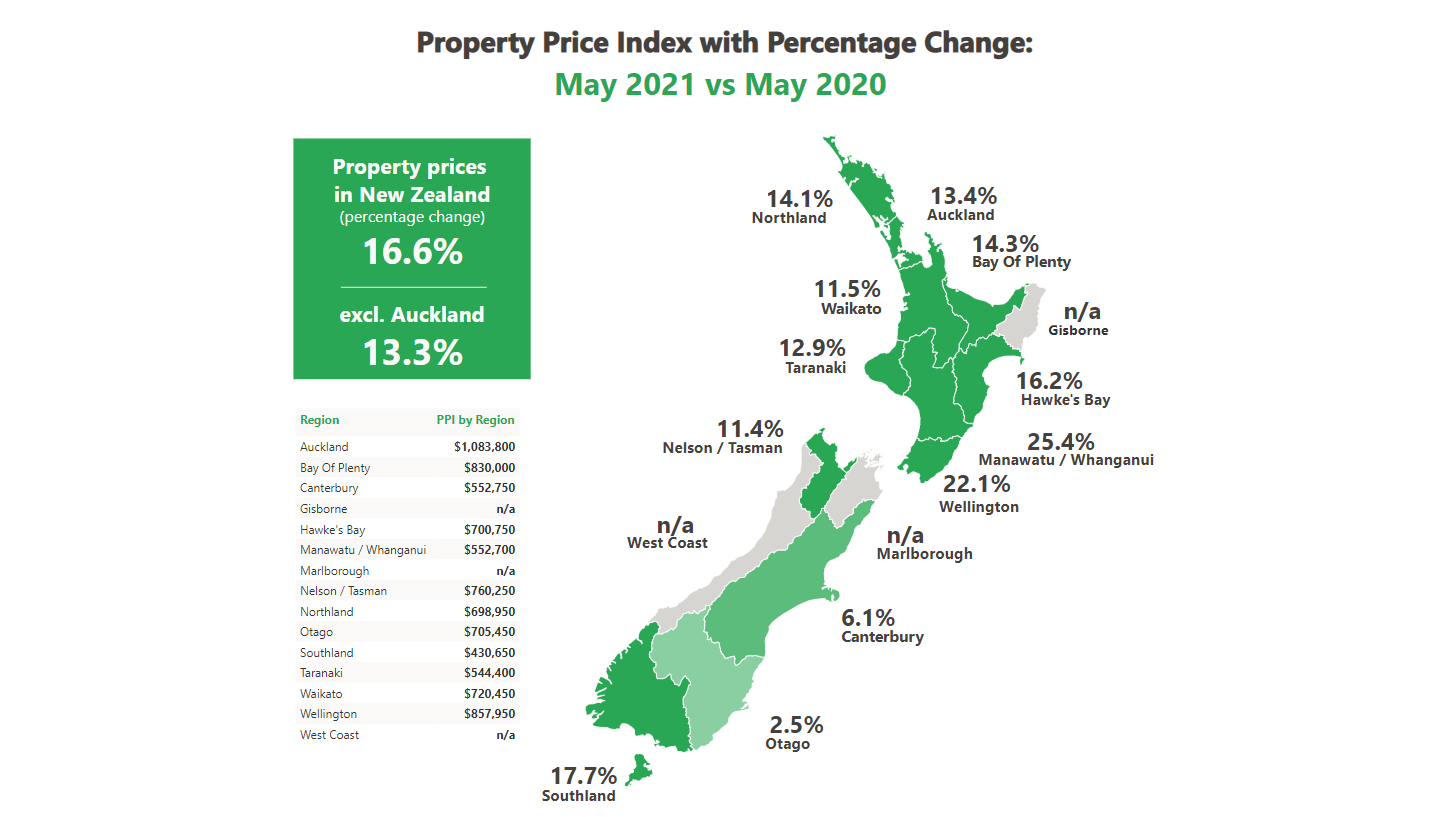
Wellington prices increase by 22 per cent in 12 months

In the Wellington region the average asking price reached $857,950 last month. “This is a colossal 22 per cent increase when compared with May 2020 - the biggest year-on-year percentage increase the region has ever seen.

“Looking at Wellington City, the average asking price was $940,200 in May, a 13 per cent jump when compared with the year prior. This marked the sixth month in a row the district saw a year-on-year increase of over 10 per cent.”

Most expensive districts in the Wellington region - May 2021
DistrictAverage asking price - May 2021 *new record 
Wellington CityWellington City$940,200* $940,200* 
PoriruaPorirua$888,000$888,000
Upper HuttUpper Hutt$830,550*$830,550*

Mr Lloyd said supply in the region was down by 5 per cent month-on-month, while supply was down 3 per cent.

“The most popular house in the country in May was a three bedroom house on Frobisher Street, Island Bay. It had an asking price of $650,000 and received 400 watchlists in its first 2 days onsite”

Auckland region prices reach an all time high

The Auckland region also saw a record breaking month in May.”The average asking price in the region increased by 13 per cent year-on-year to a new high of $1,083,800.”

In Auckland City, the average asking price was $1,209,600, marking a 10 per cent year-on-year increase and making it the fourth most expensive district in the region.”

Most expensive districts in the Auckland region - May 2021 *new record
District Average asking price - May 202 
Waiheke IslandWaiheke Island$1,819,550*$1,819,550*
North Shore CityNorth Shore City$1,281,850*$1,281,850*
Rodney Rodney $1,210,150*$1,210,150*

“Regional supply was down 3 per cent month-on -month, while demand was up 5 per cent.”

“The most popular property listing in the Auckland region last month was a two-bedroom house with an asking price of $900,000 on Hull Place, Onehunga. It received 281 watchlists in its first 48 hours onsite.”

Regional markets show demand is up

Looking around the regions, supply was down in every region except Manawatū/Whanganui(5%), Southland (3%), and Hawkes Bay (1%) in May when compared with April. “The biggest percentage drops were seen in Otago (-5%), Taranaki (-7%), and Northland (-8%).”

Mr Lloyd said it was a different story looking at demand, which increased in 12 out of 15 regions in May when compared with the prior month. “Taranaki (0%), Otago (-2%) and Wellington (-3%) were the only regions that did not see demand increase last month.”

The Hawkes Bay region had a standout month in May. “On top of seeing the largest increase in demand of all regions last month, with listings up 7 per cent month-on-month, the average asking price in the region entered the 700k bracket for the first time at $700,750.”

Small, medium, and large-sized house prices reach new high

Record highs were seen for houses of all sizes last month. “The biggest increase was seen for small houses (1-2 bedrooms), followed by medium-sized houses (3-4 bedrooms) and then large houses 5+ bedrooms).”

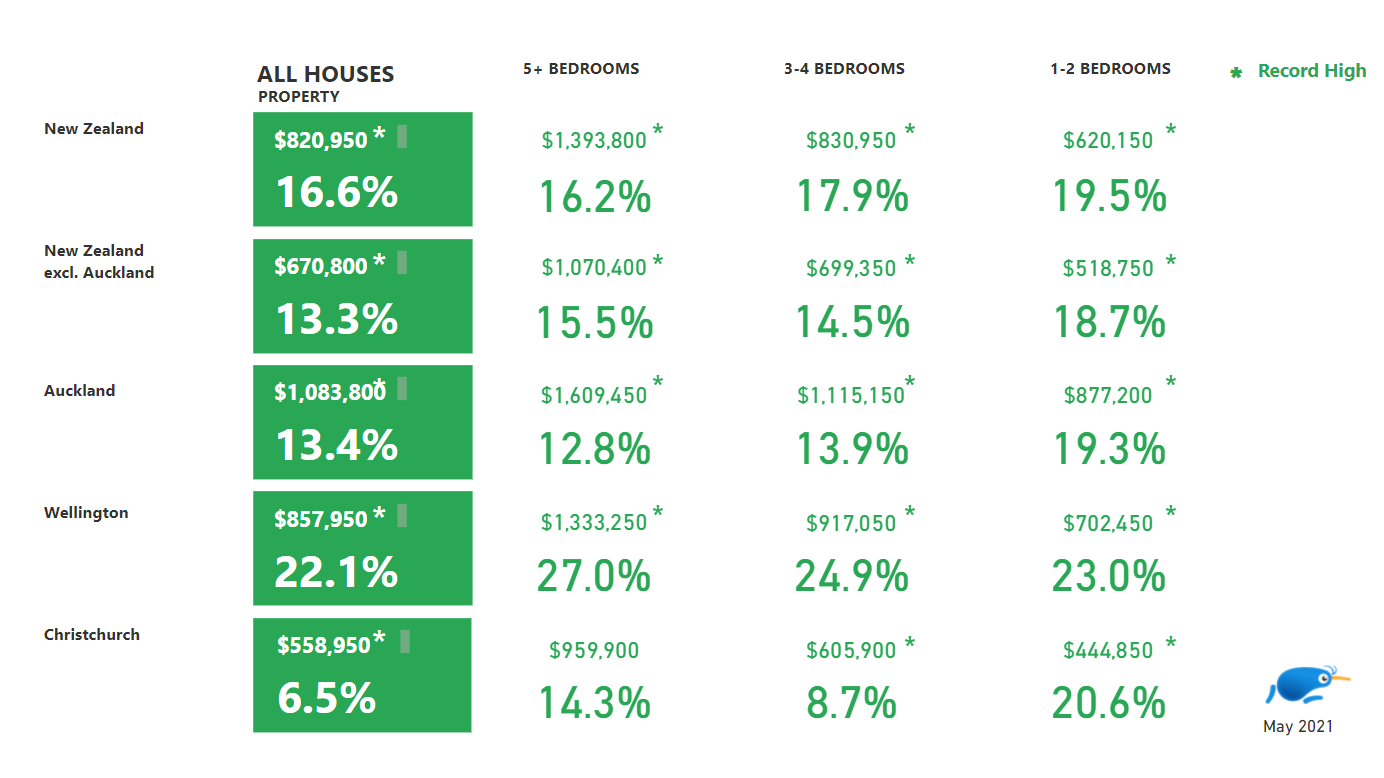
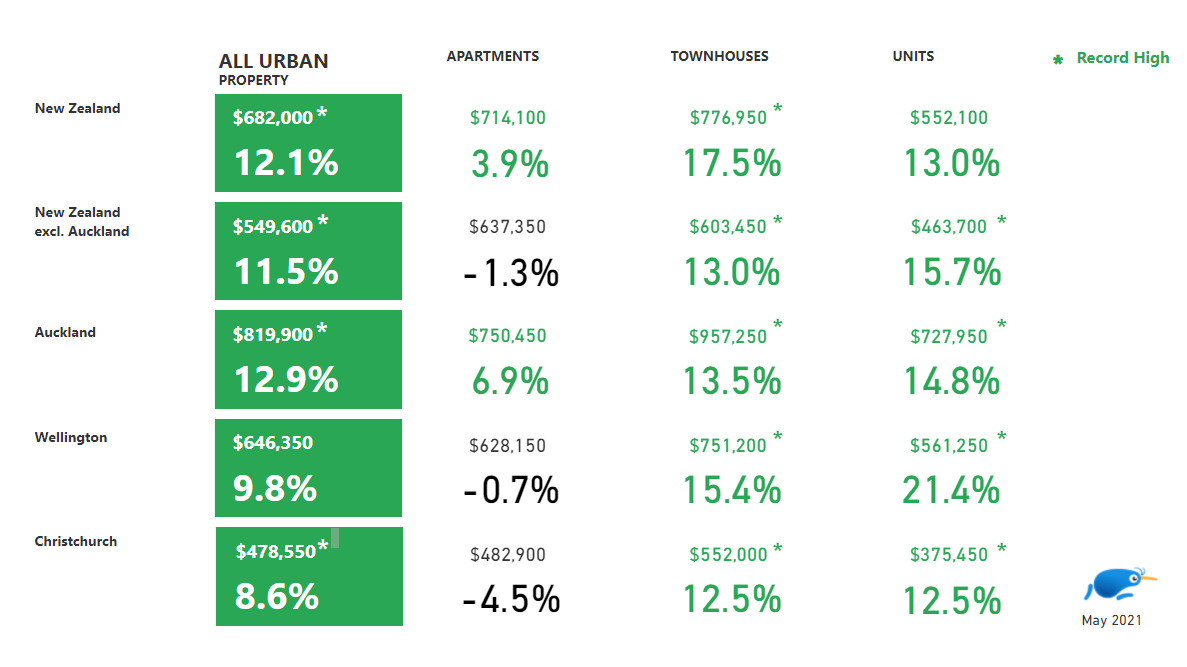
All urban property prices see year-on-year price increase

Apartments, townhouses and units all had a record-breaking May, seeing new national high average asking prices last month. “Townhouses saw the biggest year-on-year increase, up 17.5 per cent when compared with May 2020.”

MORE INFORMATION

About the Trade Me Property Price Index:

  • The Trade Me Property Price Index measures trends in the expectations of selling prices for residential property listings added to Trade Me Property by real estate agents and private sellers over the past three months.
  • It provides buyers, sellers and realtors with insights into ‘for sale’ price trends by property type and property size.
  • The Index is produced from data on properties listed on Trade Me Property in the three months leading up to the last day of each period. Each period’s value is a truncated mean of the complete three months’ worth of listings. This is to better reflect trends in property prices rather than month-to-month fluctuations in housing stock.
  • The Index uses an “80% truncated mean” of the expected sale price to calculate the average asking price. This excludes the upper and lower 10% of listings by price, and averages the expected sale prices of the remaining properties.
  • It provides an insight into ‘for sale’ price trends by type and size of property. Other reports aggregate property price data across these various properties.