News Next article
Property Price Index - November 2020
New Zealand’s property market is finishing off the year with a bang.
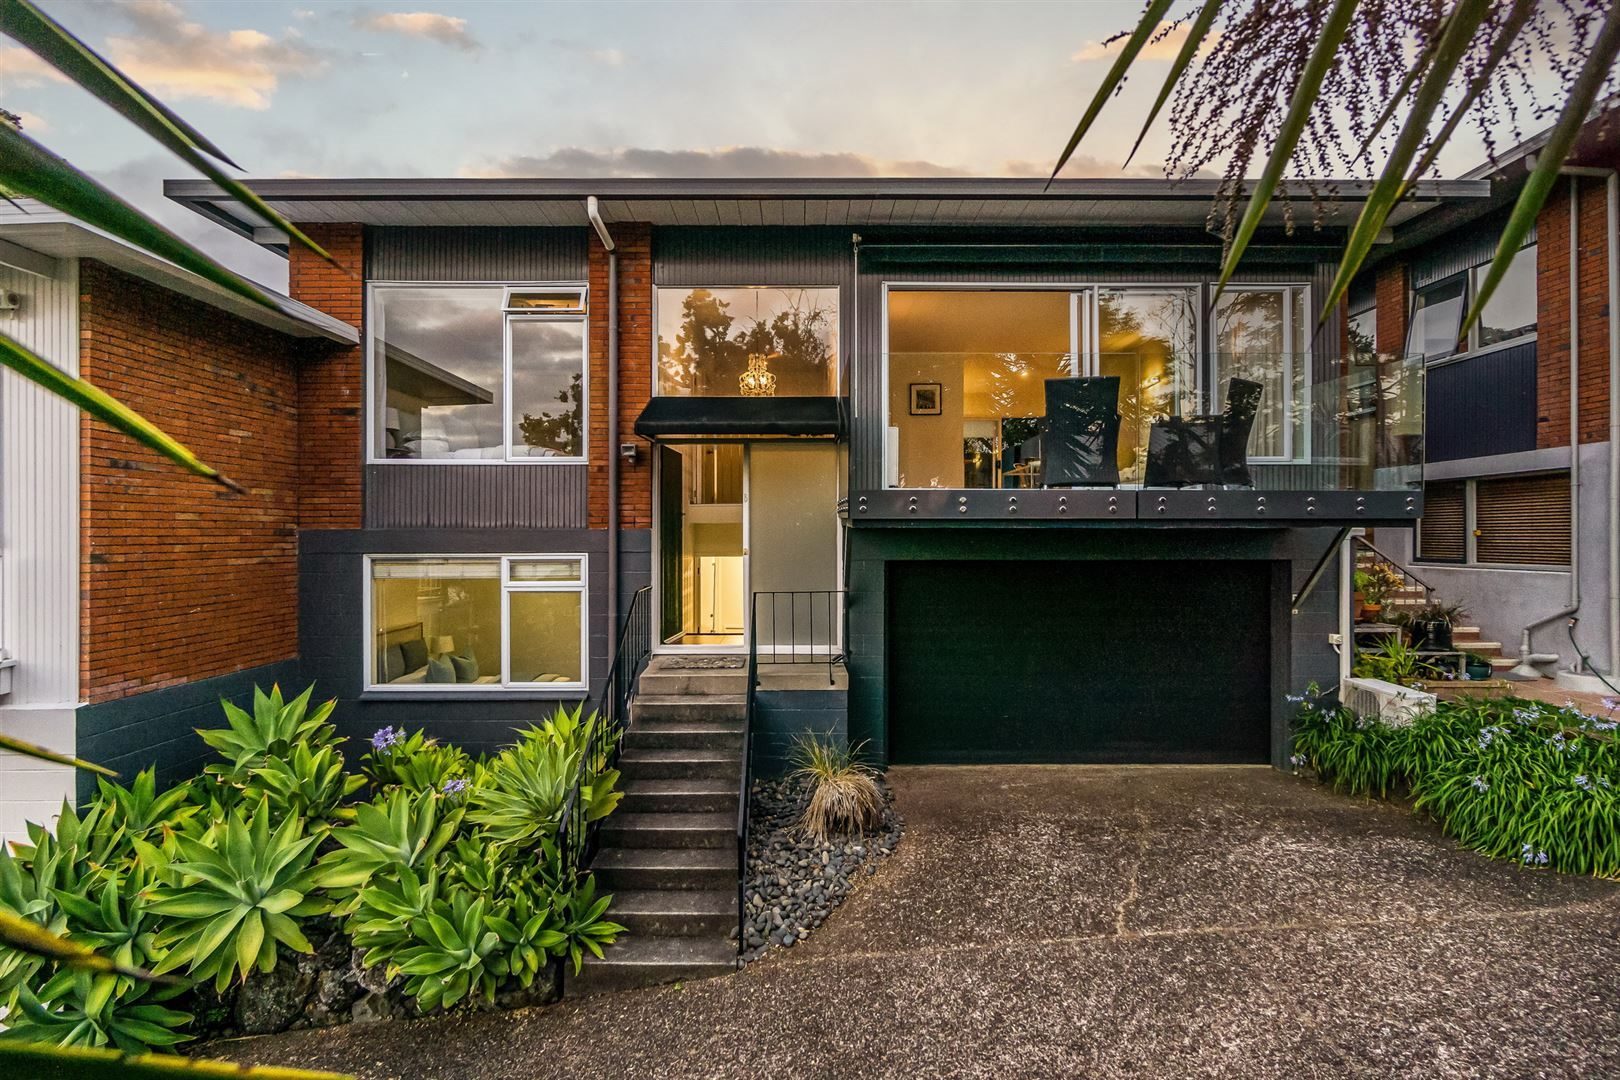
17 December 202014B Rangitira Avenue, Takapuna, Auckland
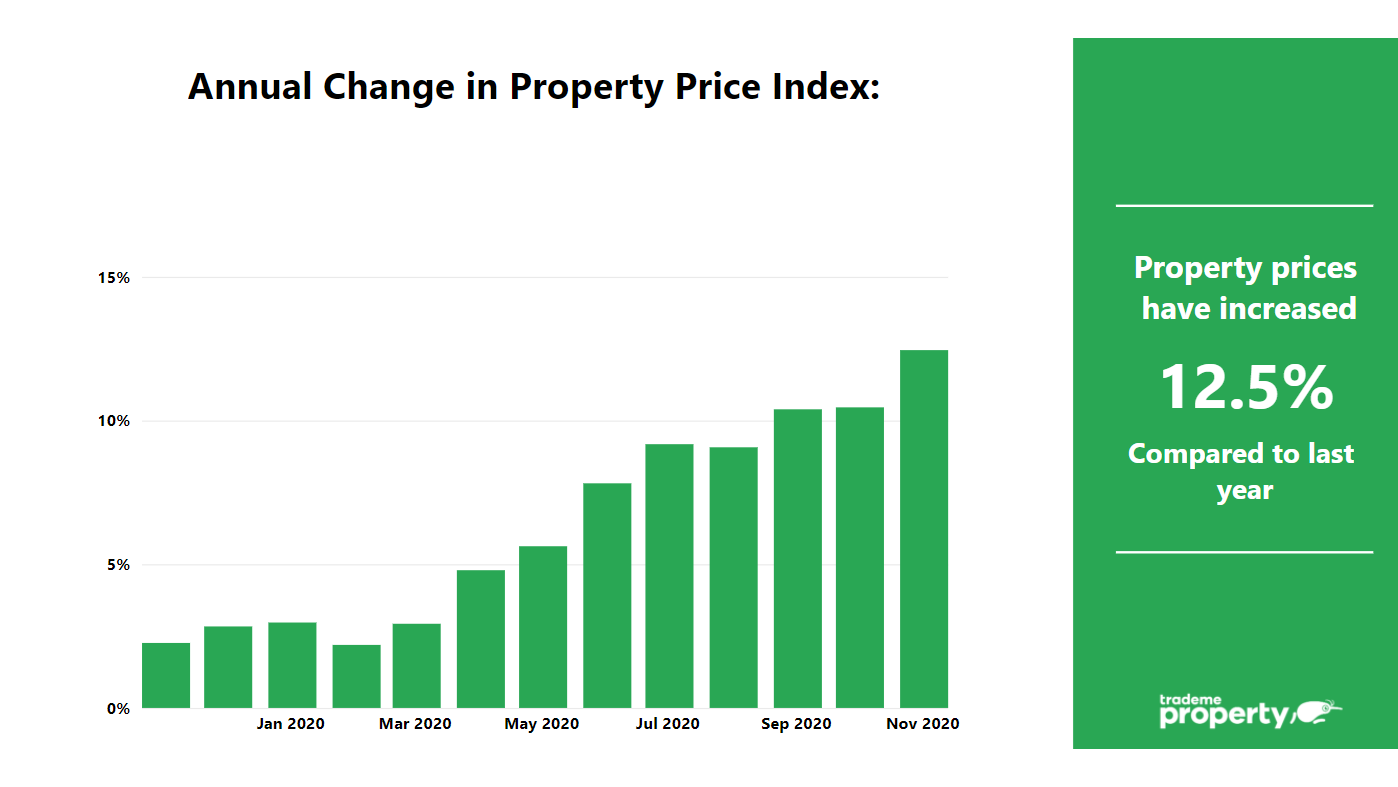
New Zealand’s property market is finishing off the year with a bang, with the national average asking price reaching an all-time high in November, according to the latest Trade Me Property Price Index.
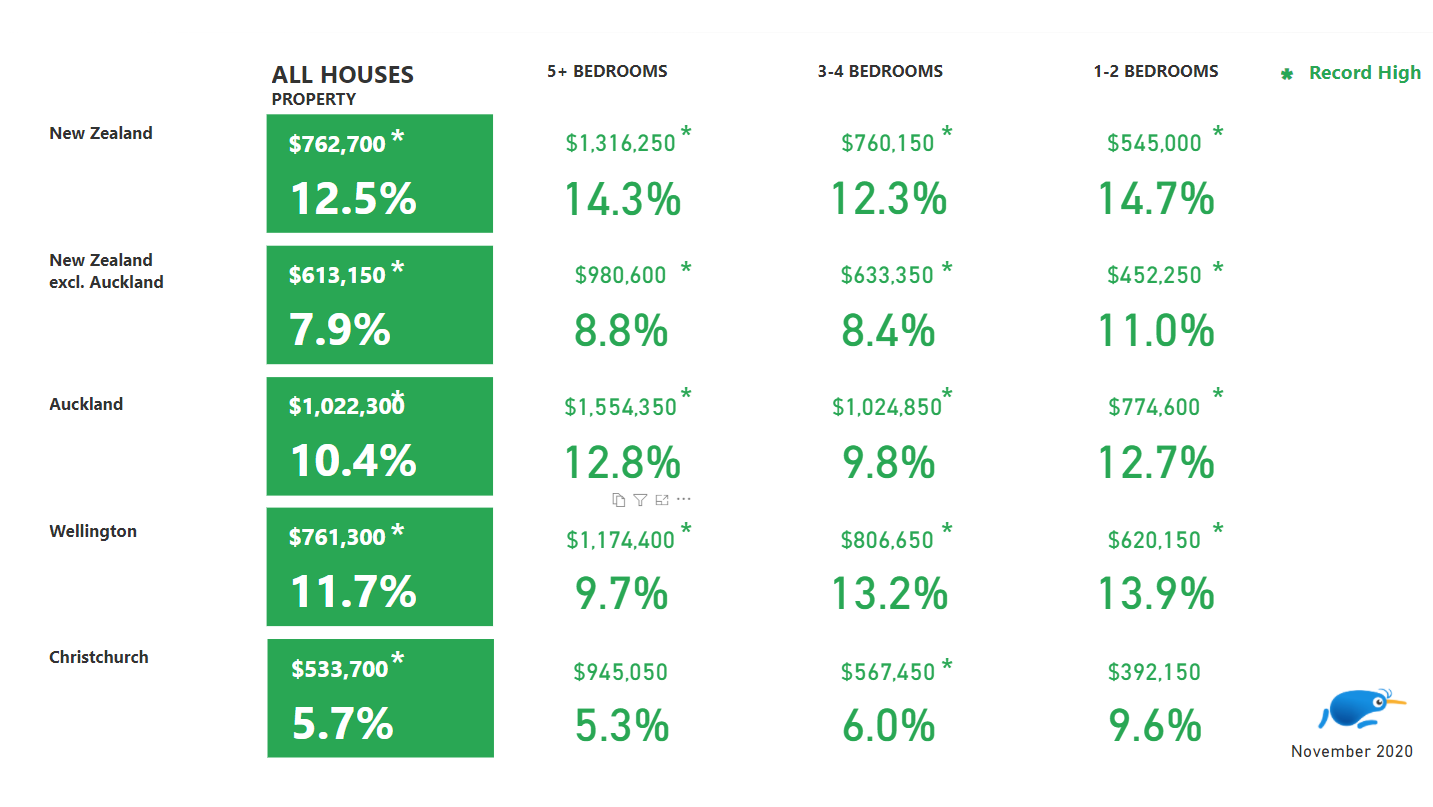
Trade Me Property spokesperson Logan Mudge said the national average asking price rose 12.5 per cent year-on-year in November to reach $762,700. “As the weather heats up, we’re continuing to see house prices around the country head north, with November marking the third record-breaking month in a row.”
Mr Mudge said house prices had continued to go from strength-to-strength this year despite some predicting they would slow due to economic uncertainty following the lockdowns. “Earlier in the year, it was anyone’s guess where the market was heading, but November proved itself to be yet another month of house price inflation.”
Mr Mudge put the increases down to the imbalance in supply and demand. “Similar to what we have seen in previous months, buyer demand was sky-high in November and the number of properties for sale didn’t keep up.
“When compared with November 2019, national demand was up by 21 per cent, while supply was down by 5 percent.”
Looking ahead to the New Year, Mr Mudge said it was unlikely that we would see house prices cool off anytime soon. “Typically summer is when we see the market really take off and we’re not seeing signs this year will be any different.”
Auckland price reach new highs
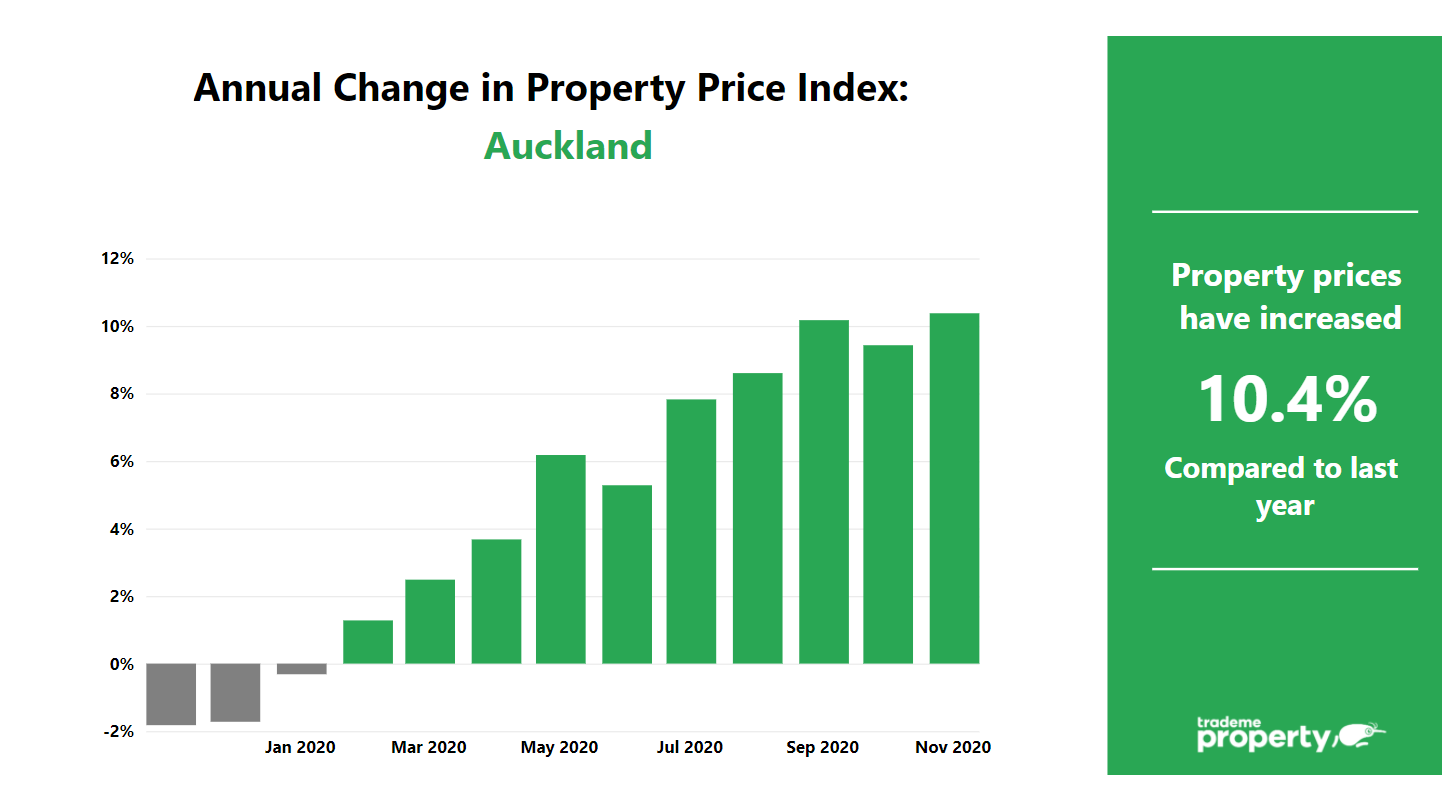
The Auckland region also had a record-breaking month, with the average asking price reaching $1,022,300 - up by 10 per cent when compared with November 2019. “Auckland City was the most expensive district in the region, with an average asking price of $1,232,650 up 12 per cent year-on-year.”
“Auckland bucked the supply trend seen around the rest of the country, with the number of properties listed onsite actually increasing (up 10%) when compared with last year.” However, Mr Mudge said the region also saw one of the largest increases in demand (up 25%), meaning house prices kept heading north.
Mr Mudge said behind Auckland City the next most expensive district was North Shore City, with an average asking price of $1,206,450, followed by Waiheke Island with an asking price of $1,215,900.
“The most popular listing in the region last month was a three-bedroom house on Takahe Road in Titirangi for $800,000 that was watchlisted 401 times in its first two days onsite.”
The capital follows suit
House prices in the Wellington region hit an all-time high for the third consecutive month in November with every district in the region also breaking records. “The average asking price in the Wellington region reached $761,300 in November - up 12 per cent year-on-year.
“The average asking price in Wellington City also reached a new high of $864,000, up 9 per cent on the year prior.” Mr Mudge said this made it the most expensive district in the region, followed by Porirua (up 7.6 per cent to $804,300) and Lower Hutt (up 23 per cent to $741,750).
“The number of properties for sale in the Wellington region was down by 10 per cent year-on-year in November while demand was up by 20 per cent, with the gap driving prices up in every district.”
The most popular property for sale in the region in November was in Johnsonville. “The three-bedroom house on Dominion Park Street was the most popular listing in the country, watchlisted a ‘staggering’ 595 times in its first 48 hours onsite.”
12 of the 15 regions see house prices reach all-time highs
Mr Mudge said the national price increase was reflected around the country. “Taking a closer look at the regions, 12 out of 15 saw record-high average asking prices in November with every region seeing year-on-year house price growth.”
Mr Mudge said Manawatu/Whanganui had a stand-out month, with the average asking price increasing by a “whopping” 20 per cent last month when compared with the same month in 2019.
“Southland (15%), Taranaki (14%), Wellington (12%) and West Coast (12%) saw the next largest average asking price increases. In Auckland, Bay of Plenty, and Marlborough, average asking prices increased by 10 per cent year-on-year.”
Year-on-year demand was up in all regions, with the biggest changes seen in Taranaki (up 29%), Auckland (up 25%) and Canterbury (up 24%).
”On the other hand, supply was down in all regions in November when compared to last year with the exception of Auckland (up 10%) Otago (up 2%) and Gisborne (flat year-on-year).”
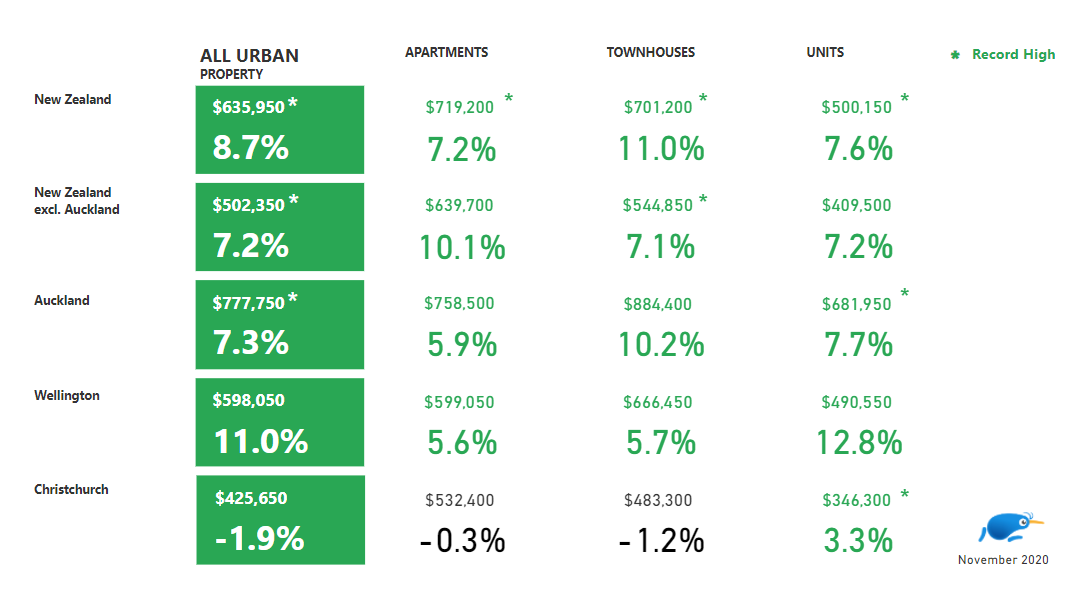
Urban properties prices break records
The average asking price for every house size in every region reached a new high with only large houses (5+ bedrooms) and small houses (1-2 bedrooms) in Christchurch bucking the trend.
The national average asking prices for all urban properties broke previous records in November.
“Townhouses saw the biggest increase, with prices growing by 11 per cent year-on-year. They were followed by units, which saw an 8 per cent increase, and apartments which saw a 7 per cent increase.”
MORE INFORMATION
About the Trade Me Property Price Index:
- The Trade Me Property Price Index measures trends in the expectations of selling prices for residential property listings added to Trade Me Property by real estate agents and private sellers over the past three months.
- It provides buyers, sellers and realtors with insights into ‘for sale’ price trends by property type and property size.
- The Index is produced from data on properties listed on Trade Me Property in the three months leading up to the last day of each period. Each period’s value is a truncated mean of the complete three months’ worth of listings. This is to better reflect trends in property prices rather than month-to-month fluctuations in housing stock.
- The Index uses an “80% truncated mean” of the expected sale price to calculate the average asking price. This excludes the upper and lower 10% of listings by price, and averages the expected sale prices of the remaining properties.
- It provides an insight into ‘for sale’ price trends by type and size of property. Other reports aggregate property price data across these various properties.
