News Next article

Rental Price Index - October 2021

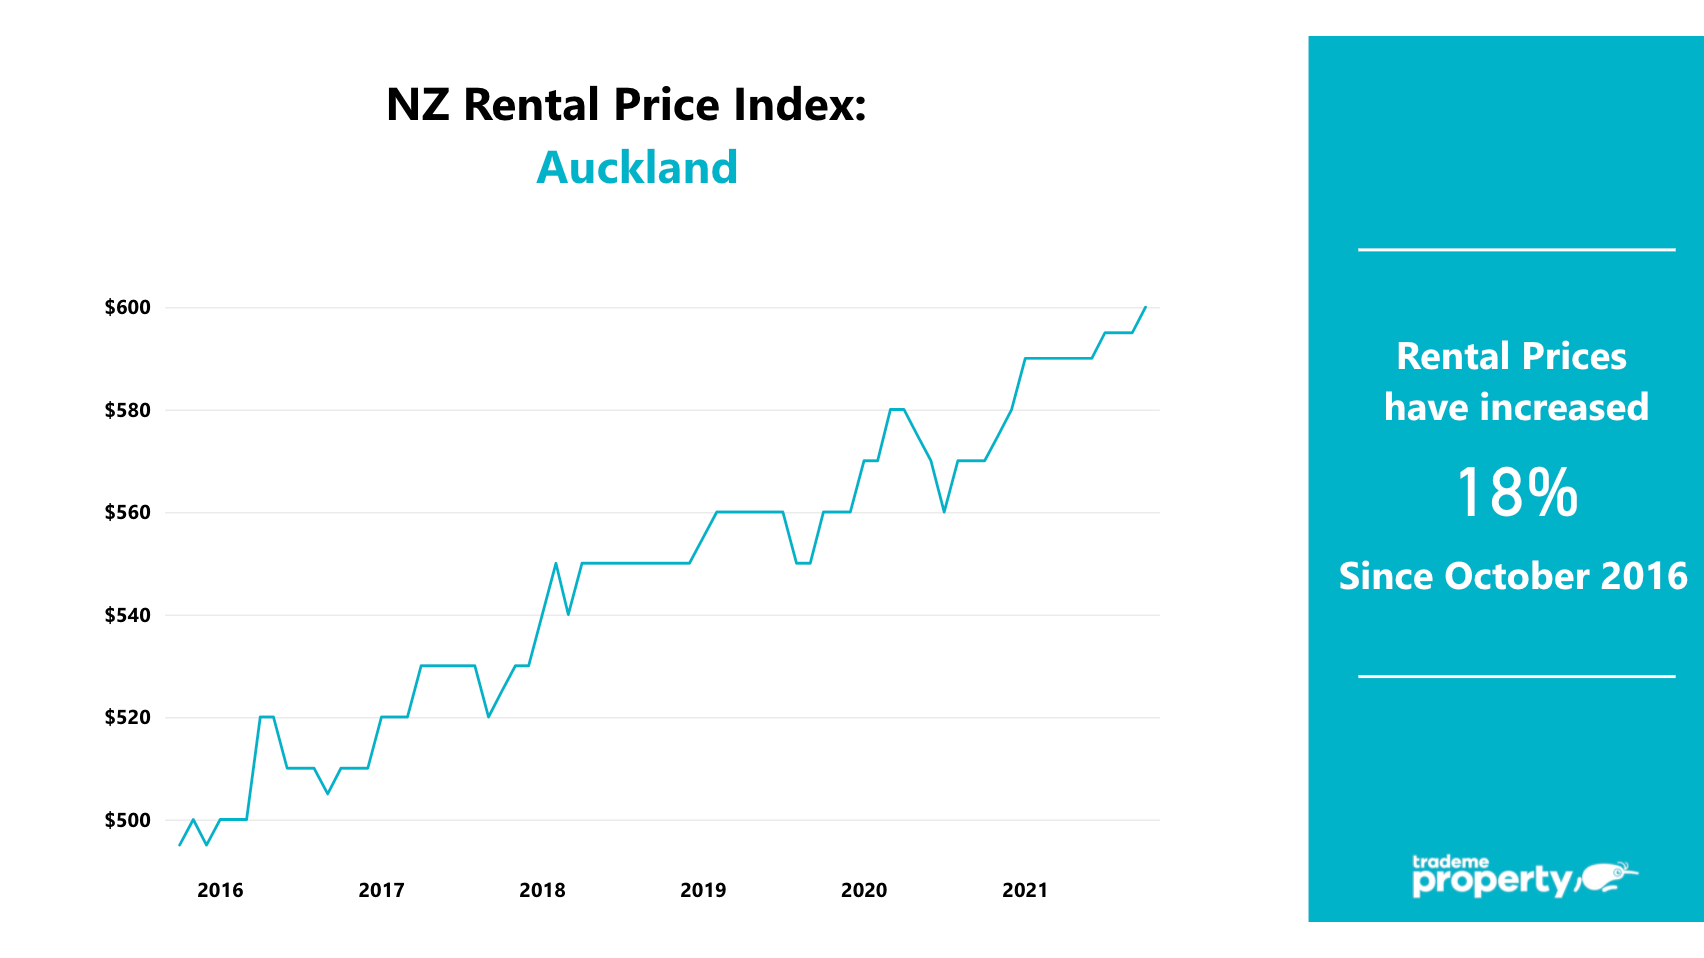
Auckland median rent hits $600 for the first time

19 November 2021

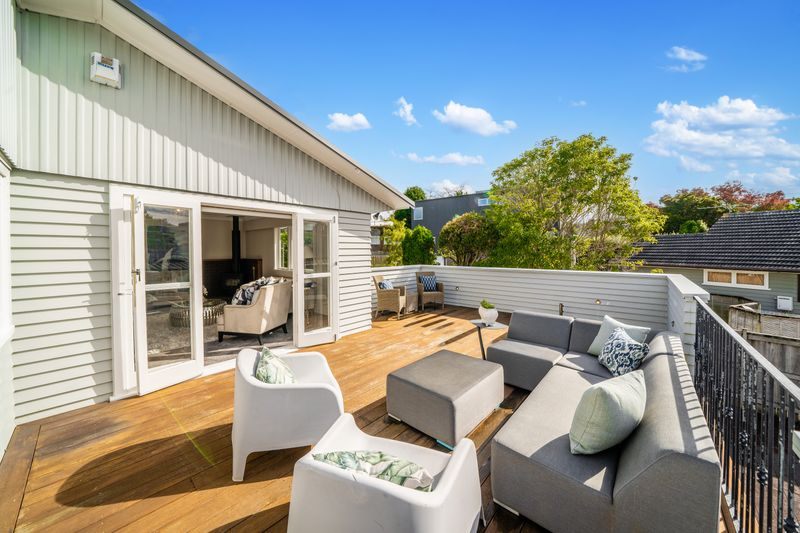
43 Ashby Avenue, Saint Heliers

Auckland’s median weekly rent cracked $600 for the first time in October, increasing by 5 per cent when compared with the same month last year, according to Trade Me’s latest Rental Price Index.

Trade Me Property Sales Director Gavin Lloyd said rents in the Auckland region have been edging closer to the $600 mark since the beginning of the year. “We saw the region’s median weekly rent stagnant at $590 from January right through to June, before it climbed to $595 in July where it sat tight right up until last month.”

Mr Lloyd said the increase will come as tough news for Auckland renters who have faced a difficult second half of the year with extended lockdowns. “It’s likely the price increase comes down to pent up demand, after Alert Level 4 brought the market to a halt in August. As soon as the rules were eased last month, many Auckland renters were keen to get a move on and we saw rental market activity spike.”

Looking around the region, Mr Lloyd said the most expensive Auckland district was North Shore City ($650), followed by Rodney ($640), and Papakura ($625) last month. “Auckland City and Waitakere City were the only two districts with median weekly rents less than $600 in the region, both sitting at $595.”

Auckland’s most expensive districts in October 2021 (*new record)
DistrictMedian Weekly Rent
North Shore CityNorth Shore City$650*$650*
RodneyRodney$640*$640*
PapakuraPapakura$625$625

Mr Lloyd said demand in the Auckland region was down by 4 per cent year-on-year in October, while supply was also down 4 per cent.

National rent sees a new high

New Zealand's national median weekly rent also reached a new high of $560 in October, increasing by 8 per cent year-on-year. “Around the country we saw a 3 per cent increase in demand for rentals last month when compared with October last year.”

Mr Lloyd said the number of rentals on the market, on the other hand, dipped last month when compared with the same month in 2020. “Supply was down 7 per cent nationwide, with the biggest drops seen in Nelson/Tasman (-41%) Bay of Plenty (-27%) Canterbury (-25%).”

Looking ahead, Mr Lloyd said we’re likely to see rental price increases continue as we head into the warmer months. “Summer tends to be the time of year that we see the most activity in the market, so unfortunately for renters, we may well see prices climb even higher yet before the year is over.”

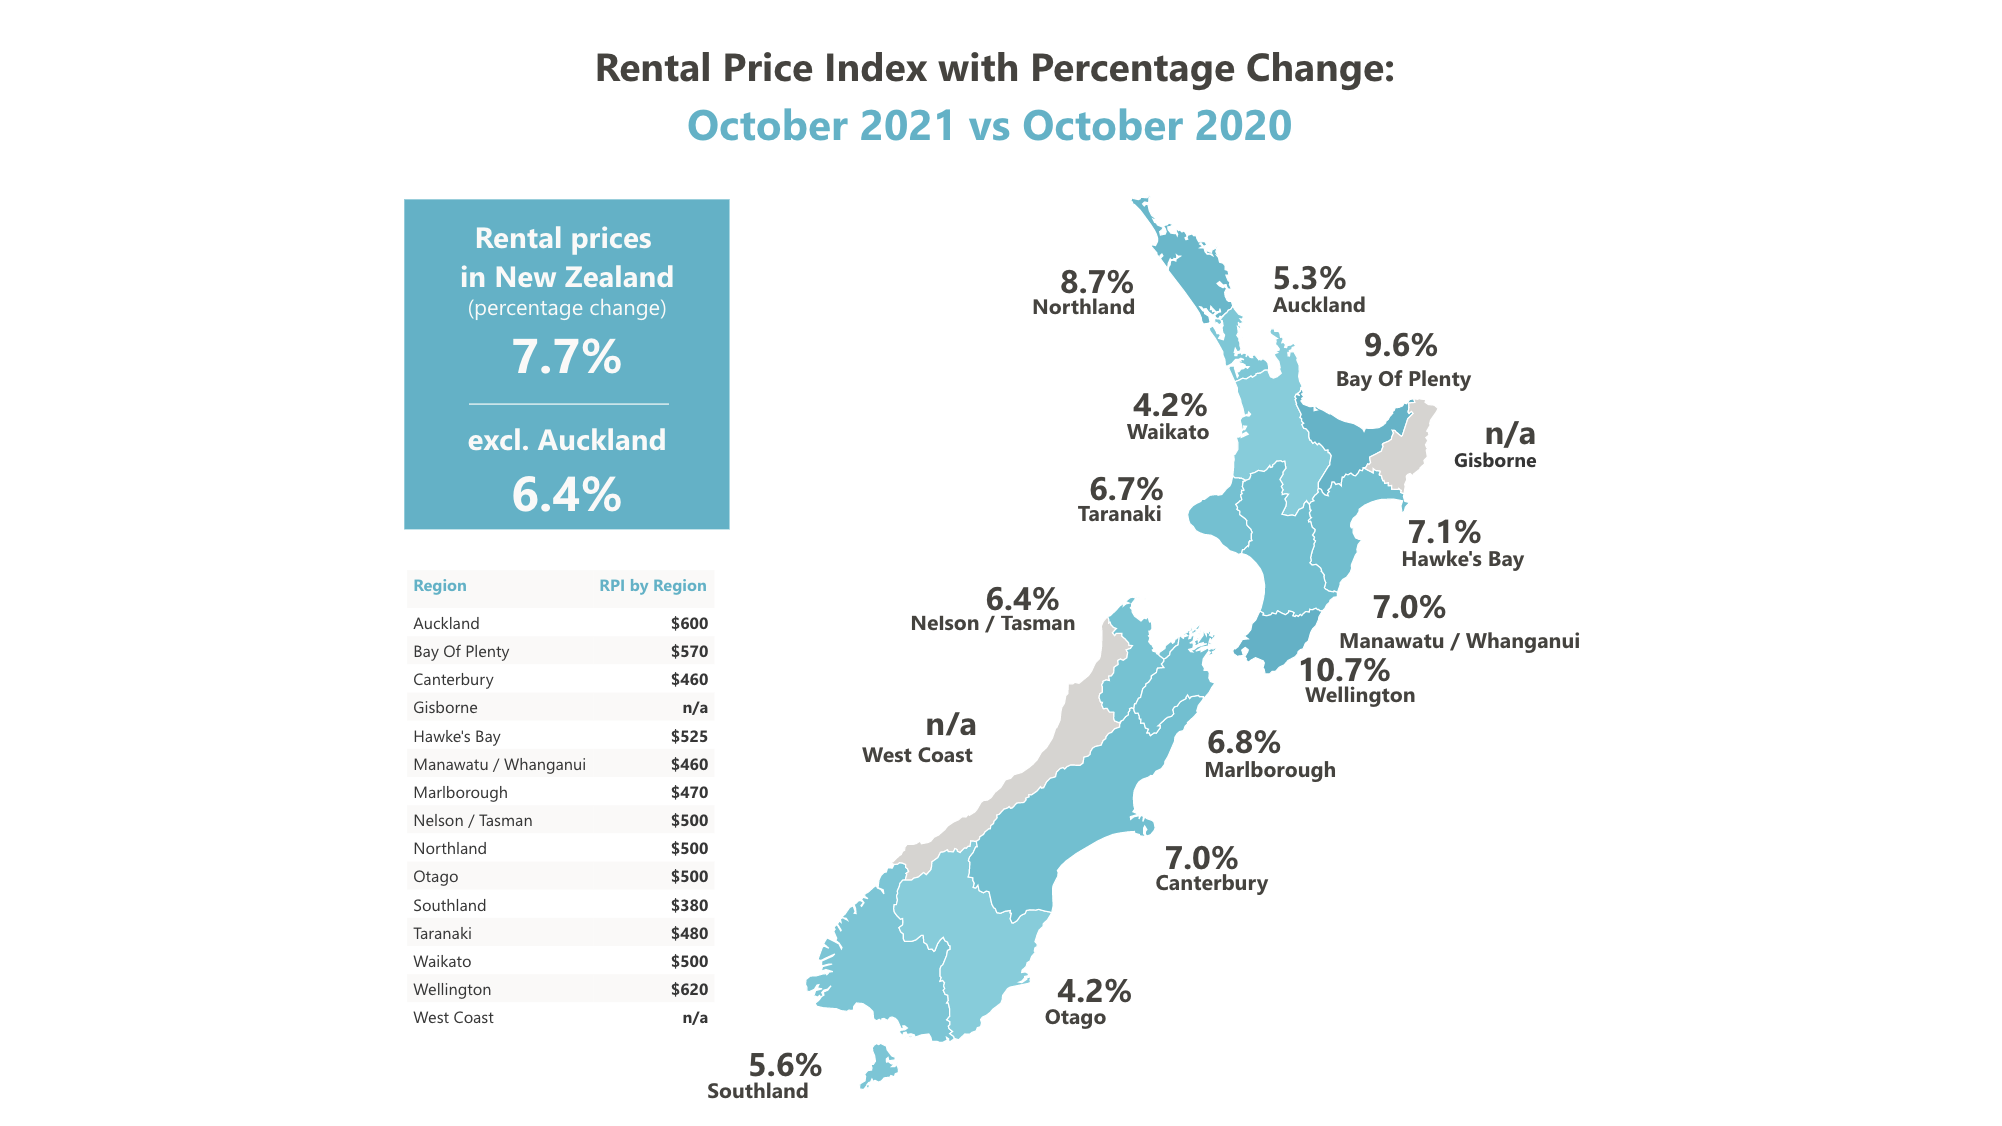
Wellington rents reach $620

The median weekly rent in the Wellington region was $620 in October, a new high for the capital. “This marked an 11 per cent increase when compared with the same month last year.”

Looking at Wellington City, the median weekly rent was $645 last month. “This made it one of the most expensive districts in the region, along with Porirua ($650) and Upper Hutt ($610).”

Wellington’ region’s most expensive districts in October 2021
DistrictMedian Weekly Rent
PoriruaPorirua$650$650
Wellington CityWellington City$645$645
Upper HuttUpper Hutt$610$610

Demand for rentals in the Wellington region in October was up by 13 per cent last month when compared with the same month in 2020, while supply was down by 5 per cent.

“The most popular rental in the region last month was a three-bedroom apartment on Normanby Street, Newtown, for $650 per week. The property received 92 enquiries in its first two days onsite.”

Record high rents for small and medium properties

Mr Lloyd said large properties (5+ bedrooms) were the only property type to not see an all-time high median rent last month. “Both small (1-2 bedroom) properties and medium (3-4 bedrooms) properties reached a record high median weekly rent in October.”

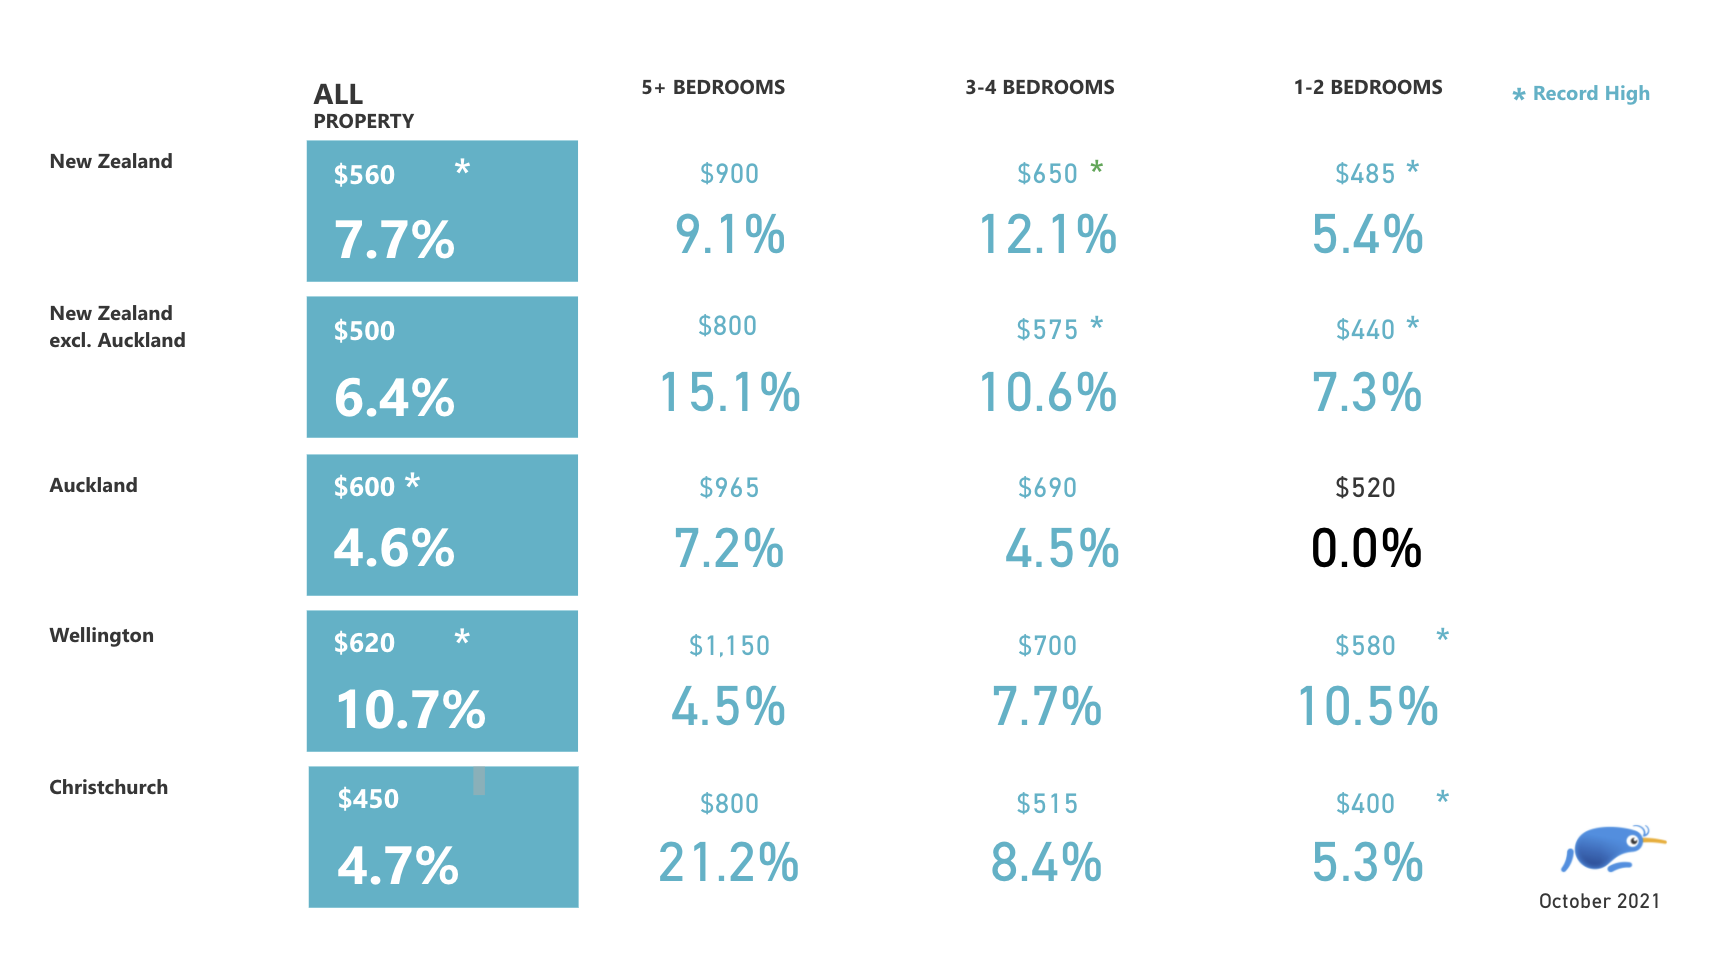
New records for townhouse and unit rents

Urban properties saw rent increases across the board last month, with the exception of apartments. ”The median weekly rents for urban properties (apartments, townhouses and units) in Wellington saw the largest year-on-year percentage change last month, up 10 per cent when compared with October last year.

Urban type comparison

NOTES


  • About the Trade Me Property Rental Price Index: This report provides a comprehensive monthly insight into the rental market covering price trends by type and size of property across New Zealand. The index is produced from Trade Me Property data of properties that have been rented in the month by property managers and private landlords. On average over 11,000 properties are rented each month and the report provides a comprehensive insight into this part of the property market for tenants, landlords and investors. The index is calculated using the rounded median rent in the month, this being an accurate statistical assessment of the current rent being charged by landlords and property managers.