News Next article
Auckland de-throned as most expensive property market
Property Pulse Report - January 2026
By Gavin Lloyd 11 December 2025
A decade in the making
National price falls
Regional growth hot spots
| Region | Property Price Index | YoY % change | |||
|---|---|---|---|---|---|
| Auckland | Auckland | $951,550 | $951,550 | -2.6% | -2.6% |
| Bay of Plenty | Bay of Plenty | $963,000 | $963,000 | 8.2% | 8.2% |
| Canterbury | Canterbury | $713,600 | $713,600 | 7.5% | 7.5% |
| Gisborne | Gisborne | $463,100 | $463,100 | -34.2% | -34.2% |
| Hawke's Bay | Hawke's Bay | $742,050 | $742,050 | 4.6% | 4.6% |
| Manawatuū/Whanganui | Manawatuū/Whanganui | $571,000 | $571,000 | 1.3% | 1.3% |
| Marlborough | Marlborough | $725,650 | $725,650 | -5.5% | -5.5% |
| Nelson/Tasman | Nelson/Tasman | $831,000 | $831,000 | 5.5% | 5.5% |
| Northland | Northland | $800,300 | $800,300 | -0.2% | -0.2% |
| Otago | Otago | $877,950 | $877,950 | 5.1% | 5.1% |
| Southland | Southland | $509,600 | $509,600 | 1.6% | 1.6% |
| Taranaki | Taranaki | $664,700 | $664,700 | -3.6% | -3.6% |
| Waikato | Waikato | $808,100 | $808,100 | -0.9% | -0.9% |
| Wellington | Wellington | $727,700 | $727,700 | -5.2% | -5.2% |
| West Coast | West Coast | $469,300 | $469,300 | 4.6% | 4.6% |
Year-on-year change in the Property Price Index
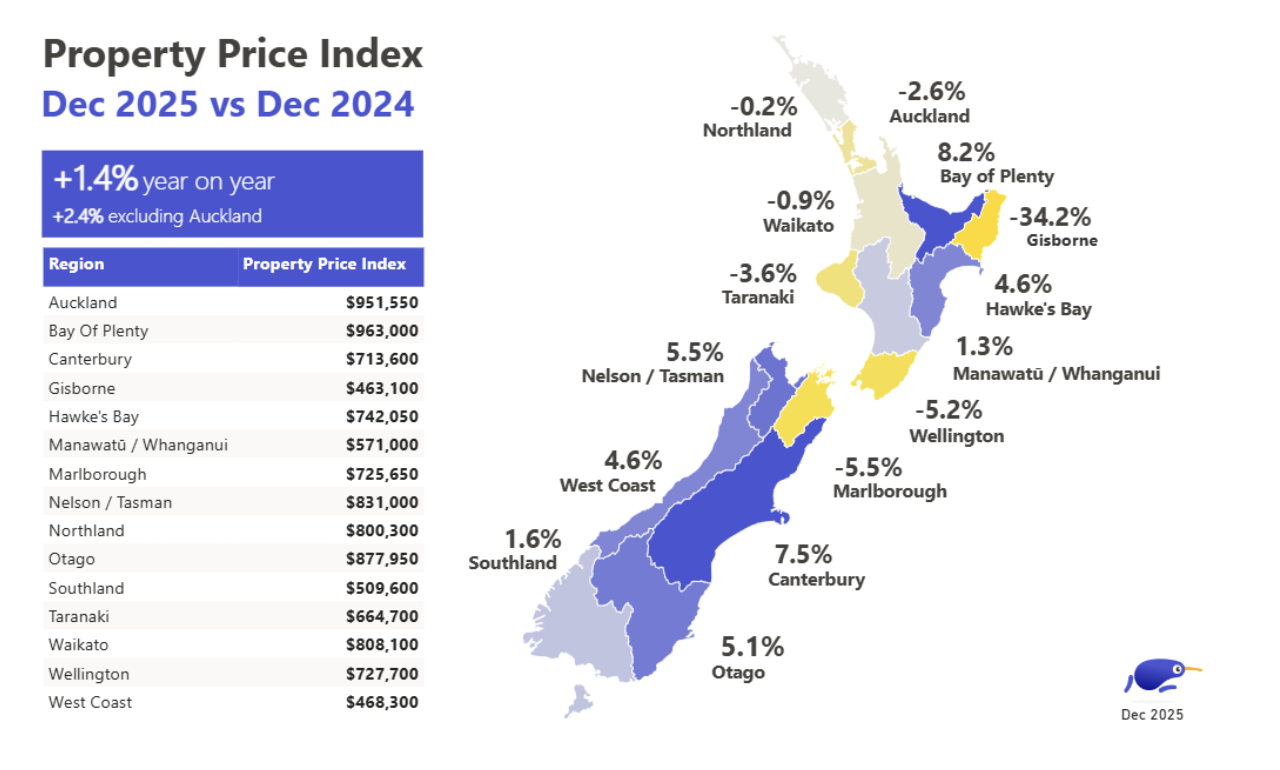
New Zealand property prices are up 1.4% year on year
Explore Past Property Market Reports
Most properties, more choice
Explore endless possibilities on NZ's favourite property app.
Download for iOS Download for Android 
Author
Other news you might like