News Next article
The Latest Property Pulse Report
Property prices cool across the motu.
By Gavin Lloyd 7 May 2025
Property prices have fallen for the second time this year, according to our monthly Property Pulse Report.
The average asking price for a property in April was $855,150, down 0.8% on March and 2.6% year-on-year.
Trade Me Property Customer Director, Gavin Lloyd says house prices dipping at this stage of the year is somewhat typical and can largely be attributed to seasonal fluctuations.
“Historically, as we move into the colder months of the year we see a dip in buyer activity, and this is reflected in the most recent data. House hunting is a lot more appealing when the sun is shining and properties look and feel their best,” says Mr Lloyd.
New Zealand Property Price Index
-0.8% month on month (+0.6% excluding Auckland)
Month-on-Month Change in Average Asking Price
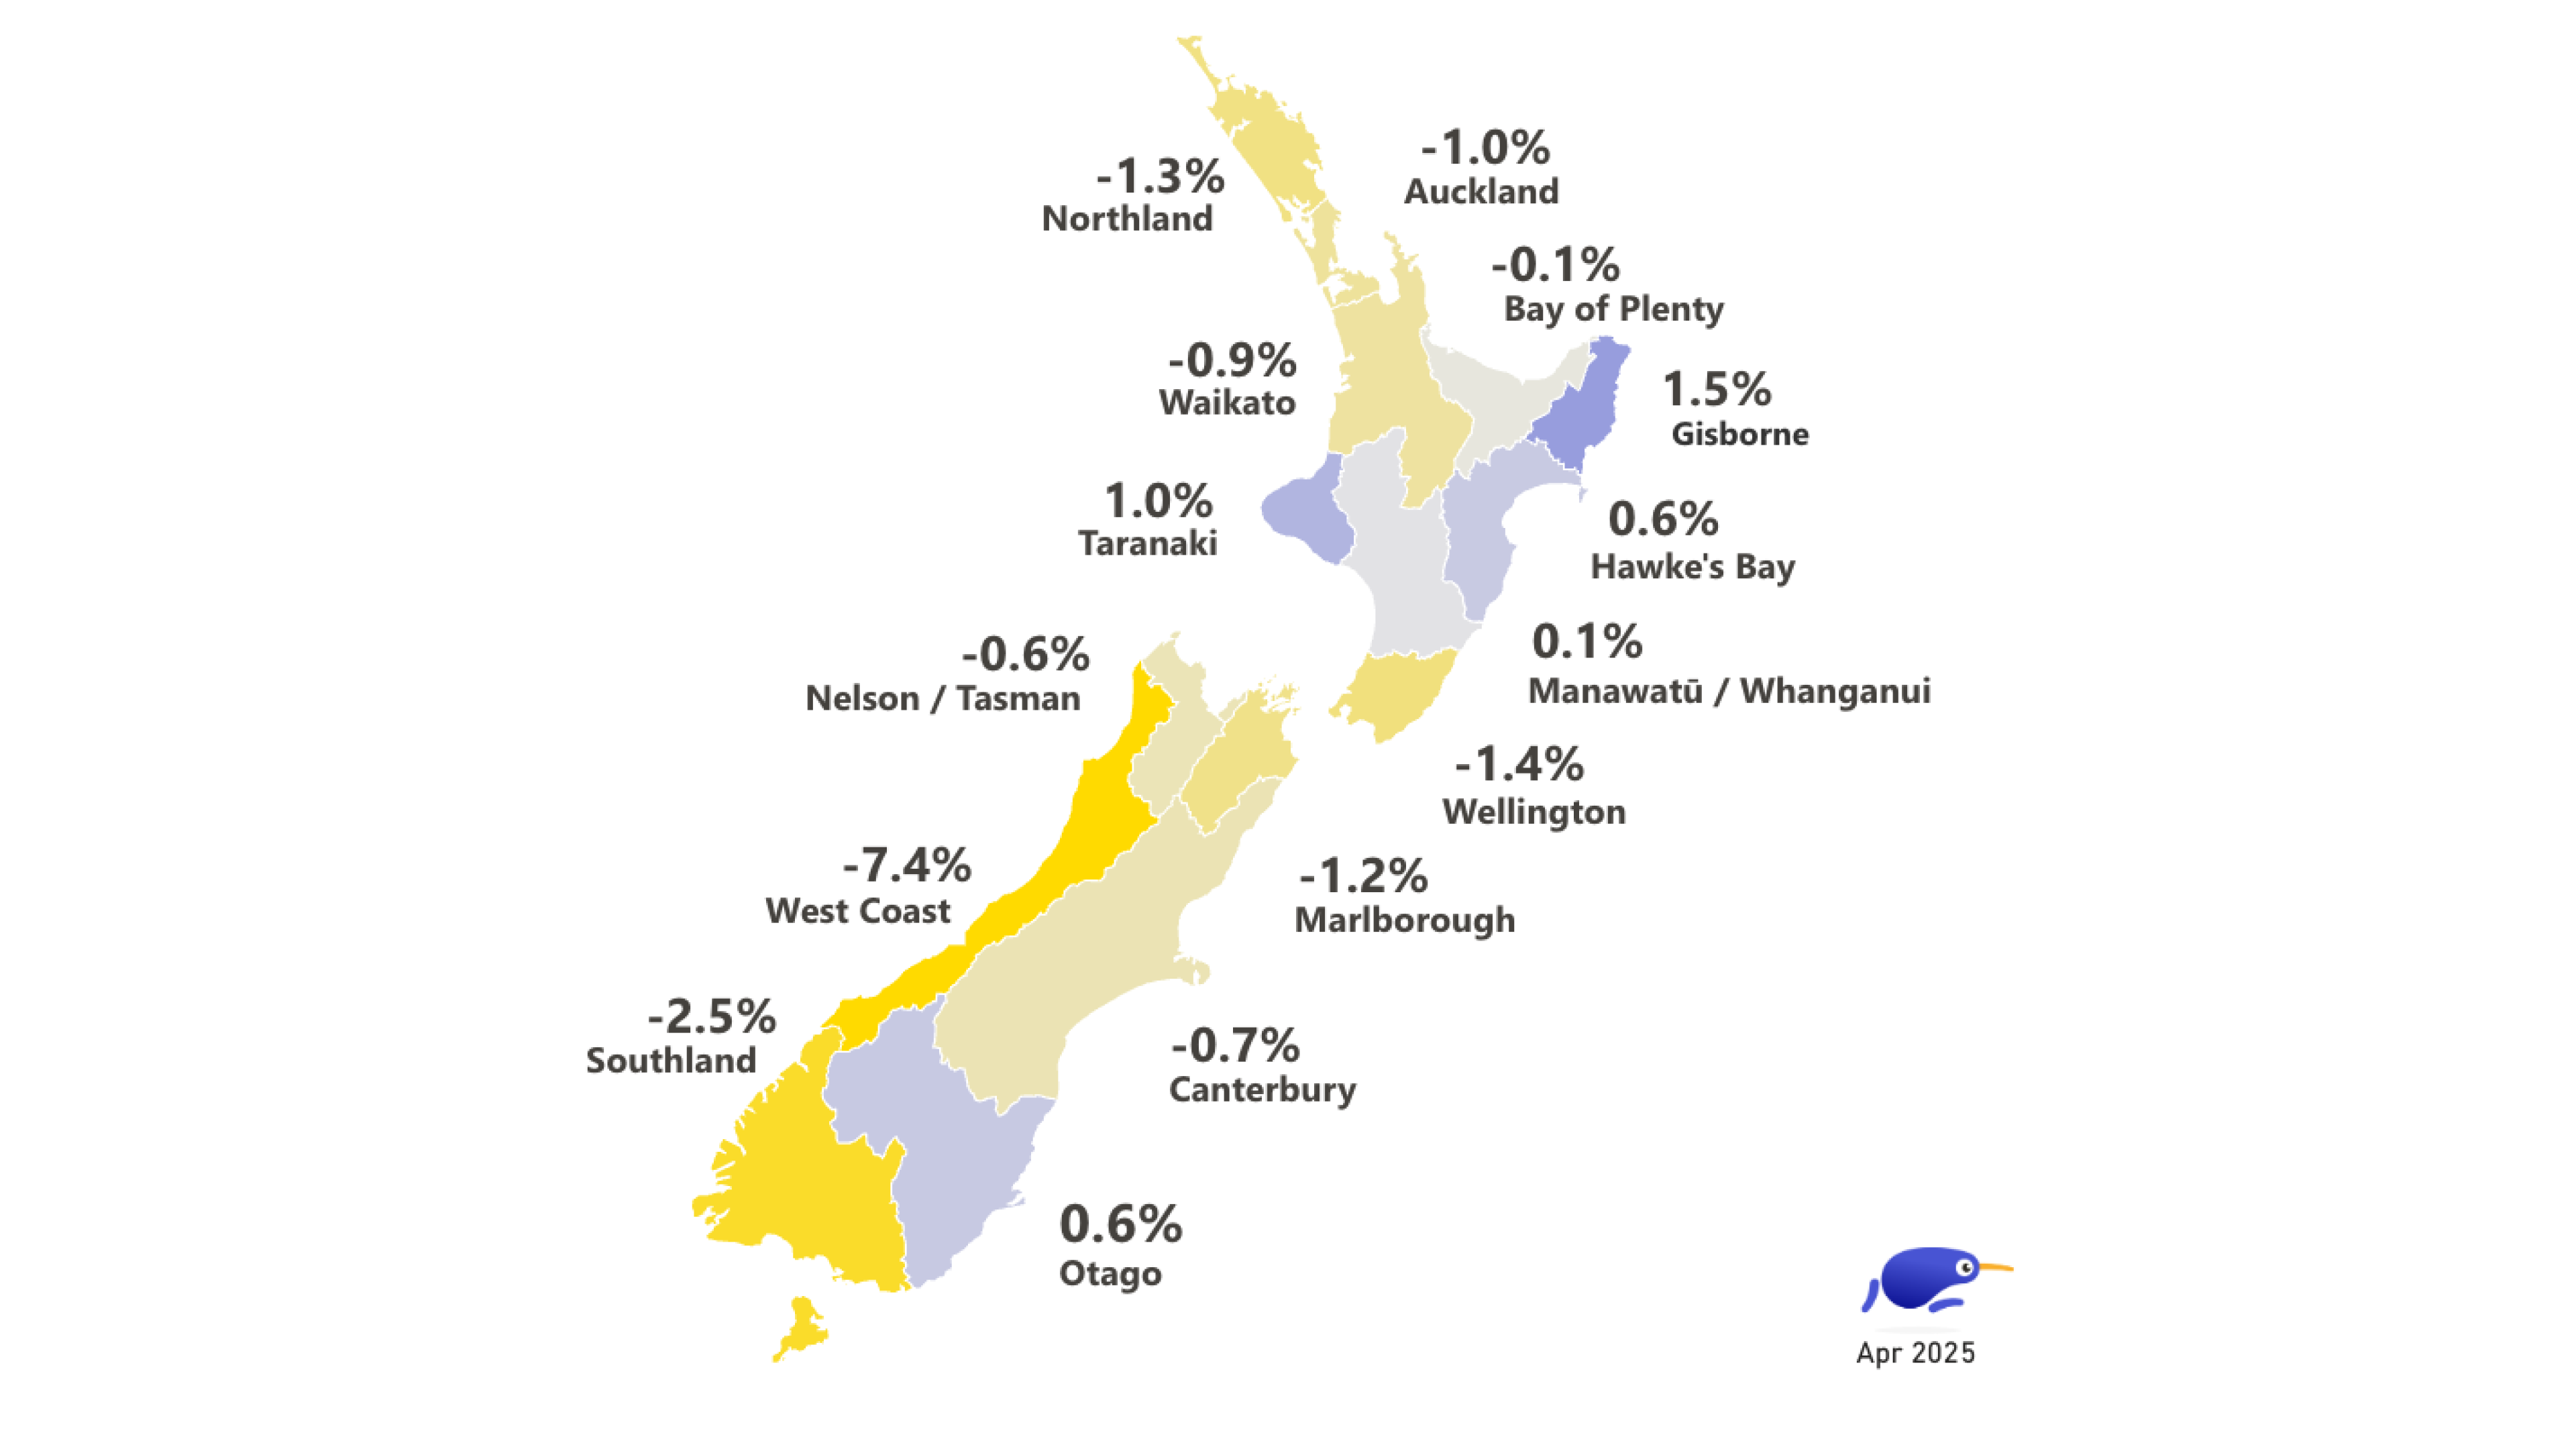
The national average asking price decreased 0.8% from March, bringing it to $855,150.
| Region | Property Price Index | MoM % change | |||
|---|---|---|---|---|---|
| Auckland | Auckland | $1,046,900 | $1,046,900 | -1.0% | -1.0% |
| Bay of Plenty | Bay of Plenty | $893,900 | $893,900 | -0.1% | -0.1% |
| Canterbury | Canterbury | $710,150 | $710,150 | -0.7% | -0.7% |
| Gisborne | Gisborne | $636,200 | $636,200 | 1.5% | 1.5% |
| Hawke’s Bay | Hawke’s Bay | $754,450 | $754,450 | 0.6% | 0.6% |
| Manawatuū/Whanganui | Manawatuū/Whanganui | $586,100 | $586,100 | 0.1% | 0.1% |
| Marlborough | Marlborough | $749,300 | $749,300 | -1.2% | -1.2% |
| Nelson/Tasman | Nelson/Tasman | $828,550 | $828,550 | -0.6% | -0.6% |
| Northland | Northland | $802,700 | $802,700 | -1.3% | -1.3% |
| Otago | Otago | $862,250 | $862,250 | 0.6% | 0.6% |
| Southland | Southland | $512,500 | $512,500 | -2.5% | -2.5% |
| Taranaki | Taranaki | $680,900 | $680,900 | 1.0% | 1.0% |
| Waikato | Waikato | $807,850 | $807,850 | -0.9% | -0.9% |
| Wellington | Wellington | $810,300 | $810,300 | -1.4% | -1.4% |
| West Coast | West Coast | $446,150 | $446,150 | -7.4% | -7.4% |
The number of days properties spent onsite also increased from an average of 56 days in March to 62 days in April, but remains well down on the average 85 days in January.
“The rule of thumb is that the longer properties spend on the market, the more sellers need to adjust their expectations, particularly when it comes to price. This is especially true in a market where there’s plenty of supply to choose from,” says Mr Lloyd.
Auckland records largest decline this year
Tāmaki Makaurau property prices fell -1.0% on March and represent the biggest month-on-month decline in eight months. Year-on-year prices in the country’s largest city are down -3.2%.
“Property prices in Auckland have been consistently inconsistent in recent months. In March we saw the average asking price reach a 10-month high, and for April prices recorded the largest fall since August 2024.
“After dipping below the million dollar average last August, many will be keeping a watchful eye on the city of sails as to how things play out as we move closer to winter.”
Drop in supply, and demand
The number of listings on Trade Me Property, which hit a decade high in March, fell 4% between March and April. Demand was also down 13% month-on-month.
“Of the 15 regions we monitor at Trade Me Property, each one recorded a decline in supply from the month prior with the biggest drops recorded on the West Coast (-7%), Nelson/Tasman (-7%), Canterbury, Gisborne and Taranaki all down 6% respectively.”
Lloyd says while the number of listings on Trade Me Property fell between March and April there remains plenty of choice for house-hunters.
“To give some perspective, we had several thousand more properties listed onsite in April of this year compared to April 2024. That means buyers continue to have plenty of leverage and to secure a sale, vendors are going to need to meet the market, particularly in regards to realistic price expectations.”
| Location | Property | Apartments | Townhouses | Units | |||||
|---|---|---|---|---|---|---|---|---|---|
| New Zealand | New Zealand | -2.3% $699,050 | -2.3% $699,050 | -5.8% $711,700 | -5.8% $711,700 | -2.1% $767,950 | -2.1% $767,950 | -2.7% $547,050 | -2.7% $547,050 |
| New Zealand (excl. Auckland City) | New Zealand (excl. Auckland City) | -3.2% $672,050 | -3.2% $672,050 | -8.3% $705,050 | -8.3% $705,050 | -3.0% $732,250 | -3.0% $732,250 | -2.3% $521,900 | -2.3% $521,900 |
| Auckland City | Auckland City | +1.0% $828,600 | +1.0% $828,600 | -2.8% $722,800 | -2.8% $722,800 | -3.7% $1,028,850 | -3.7% $1,028,850 | -0.3% $708,300 | -0.3% $708,300 |
| Wellington City | Wellington City | -14.1% $643,550 | -14.1% $643,550 | -20.2% $583,900 | -20.2% $583,900 | -3.8% $813,250 | -3.8% $813,250 | -21.3% $530,200 | -21.3% $530,200 |
| Christchurch City | Christchurch City | +1.4% $579,350 | +1.4% $579,350 | -15.2% $621,400 | -15.2% $621,400 | +0.7% $626,550 | +0.7% $626,550 | -0.4% $457,850 | -0.4% $457,850 |
Previous Property Pulse Updates
Catch up on previous Property Pulse Report updates and commentary.
NZ property market ends Summer on a warm note
9 March 2025
The tail end of Summer saw the country’s housing market continue to warm, with property prices up on February, and demand at a more than four year high.
Trade Me Property’s Property Pulse Report shows in March 2025 the average asking price increased by $10,000 (+1.2%) from February to $861,900. Year-on-year prices remain down 2.6%.
Metro centres bounce back
Trade Me Property’s Customer Director Gavin Lloyd said the average asking price in Auckland continues to grow and in March hit a 10-month high, up 1.2% on February to $1,057,300.
“Not since May of last year have we seen Tāmaki Makaurau prices where they are at currently. It was just six months ago the average asking price in Auckland dipped below one million,” says Mr Lloyd.
“While a $60-thousand dollar increase since September isn’t to be sniffed at, prices in Auckland remain 2.4% off where they were at the same time last year.”
The average asking price in Wellington also hit a 10-month high in March of $821,600. The seventh consecutive month of increases in Pōneke. In Canterbury prices hit a four month high of $714,800.
“Canterbury is the only one of the three big cities to show both month-on-month (+0.6%) and year-on-year (+0.2%) growth in March.
“While the increases in average asking prices in Canterbury are modest, they are in contrast to both Auckland where prices are down more than two%on last March, and Wellington which sits at 3.7% behind the same month last year.”
Supply and demand on the rise
The number of listings on Trade Me Property, which hit a decade high in February, continued to climb, up 6% in March, and 12% on the same month last year.
Gisborne (+31%), the West Coast (+26%), Otago (+24%) and Canterbury (+20%) led the way with the largest year-on-year increases in supply. While Southland listings are up 14% on March 2024, it’s the only region of the 15 monitored by Trade Me Property to show a decline in supply from February (-2%).
Mr Lloyd says since the start of the year, demand is also trending upwards.
“We’ve seen a fairly persistent imbalance between supply and demand in more recent times, with more homes available than demand, suppressing the big pricing gains we saw back in 2021.
“While it’s great to see demand momentum gaining, and we saw highs in March not seen since mid-2020, the current market still offers buyers a huge amount of choice.”
Price increases for big properties in Wellington
The price of larger sized properties continues to soften with homes of five or more bedrooms down 5.5% year-on-year.
“These more substantial-sized homes fell more than 14% in Auckland with an average asking price just shy of $2.4 million, while Wellington stands in stark contrast, recording a 7% increase in the prices of bigger properties.”
Author